
Trendline Breakdowns: How to Spot and Trade Major Long-Term Weekly Trend Shifts in the Indian Stock Market
Most retail traders in the Indian stock market are obsessed with the 3-minute or 5-minute charts. They spend all day fighting the algorithmic noise, trying to scalp 10 or 20 points on Nifty options.
While intraday trading is great for daily cash flow, wealth is built by catching the big moves. I am talking about the 800 to 1,500 point swings in the Nifty 50. To catch these, you have to zoom out and look at what the big players—the FIIs (Foreign Institutional Investors) and DIIs (Domestic Institutional Investors)—are doing.
And institutions do not care about a 5-minute trendline. They look at the Weekly Timeframe.
Here is exactly how you can spot a major long-term trend shift on the weekly charts and, more importantly, how to execute a trade when a structural breakdown happens.
Why the Weekly Timeframe is King
A trendline drawn on a 5-minute chart can be broken by a single random market order or a sudden news headline. It is fragile.
A trendline drawn on a Weekly chart, however, represents months or even years of psychology. Every time the Nifty touches that line and bounces, it means massive institutional buying stepped in to defend that price. The more times it is tested, the stronger it becomes.
When a line that has been defended for over a year finally breaks, it triggers a massive unwinding of long positions. This is where the fastest and most aggressive market crashes happen.
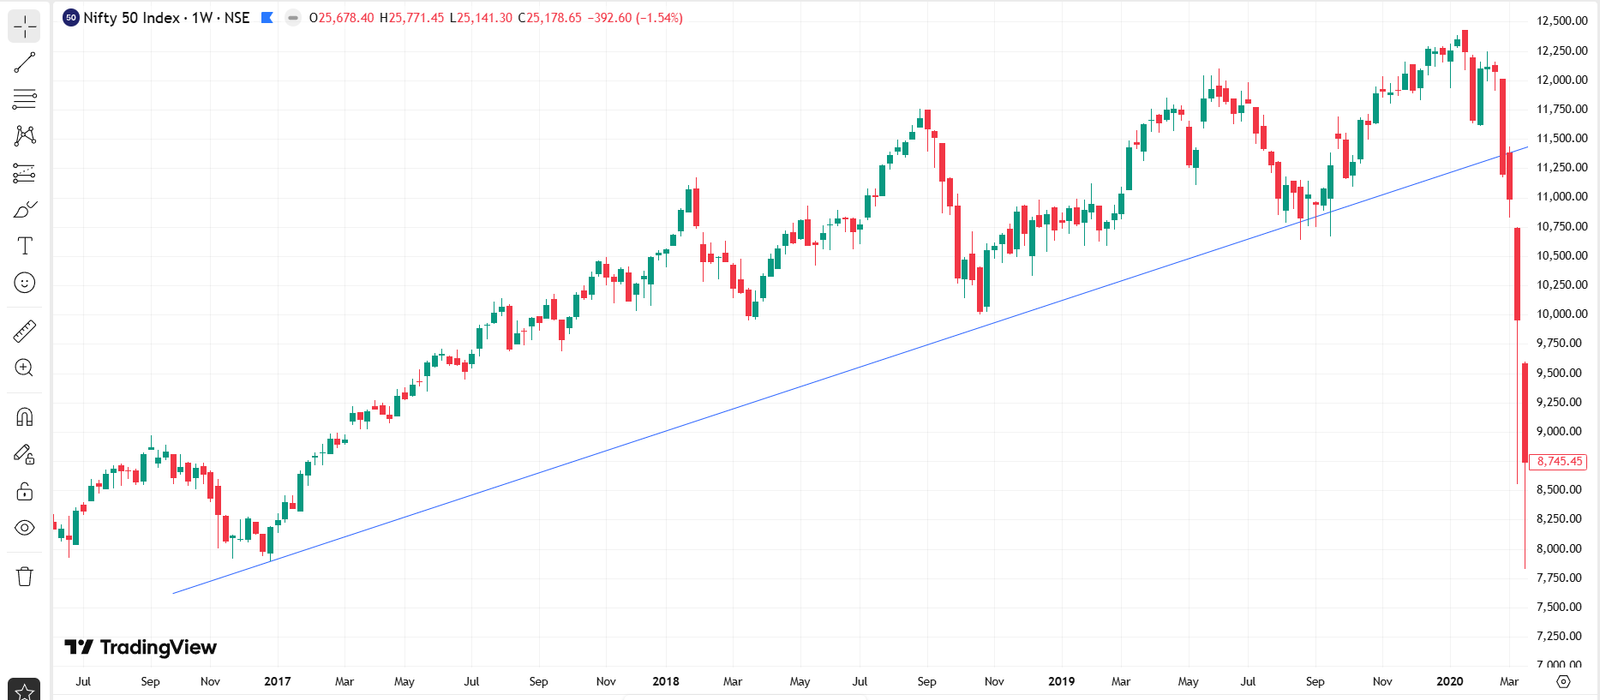
How to Draw a Valid Long-Term Trendline
Do not force a trendline where it doesn’t exist. For a weekly trendline to be valid, it must follow the “Three-Touch Rule.”
- Point A (The Origin): The start of the major rally.
- Point B (The Confirmation): The first major higher-low where the market bounced.
- Point C (The Validation): The third touch proves the trendline is a heavily watched institutional level.
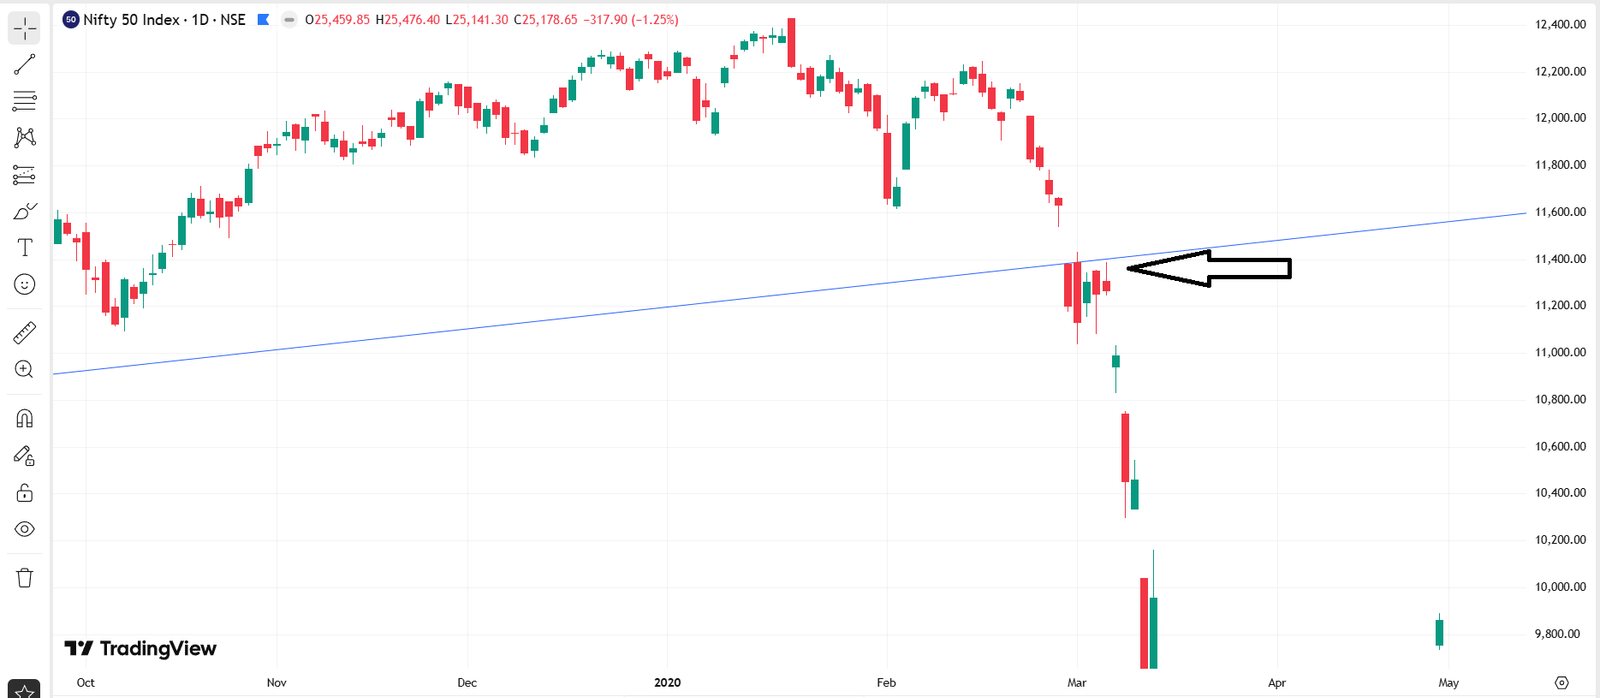
The Anatomy of a Genuine Breakdown
The biggest mistake amateur traders make is shorting the market the second the price crosses below the trendline. In the weekly timeframe, fake-outs (bear traps) are very common.
Here is the professional way to confirm a breakdown:
1. The Weekly Close
Never trust an intraday breakdown of a weekly level. The Nifty might dip below the trendline on a Wednesday, but by Friday afternoon, institutions might push it right back up, leaving a long “wick” that traps the bears. You must wait for the Friday closing bell. If the weekly candle closes solidly below the line, the breakdown is confirmed.
2. The Retest (The Safest Entry)
Once a major support line breaks, it flips and becomes heavy resistance. Often, the market will drop, panic a bit, and then rally back up to “kiss” the broken trendline one last time. This is called a retest.
When the price hits the bottom of that old trendline and forms a bearish reversal candle (like a shooting star or bearish engulfing), that is your golden entry.
How to Trade It (The Strategy)
When a weekly trend shifts from bullish to bearish, your entire trading mindset must change.
- Shift Your Intraday Bias: If you are an intraday trader using strategies like the ORB (Opening Range Breakout), you should heavily favor the Put (PE) side. Every morning bounce becomes a shorting opportunity.
- Positional Options: Do not buy far Out-Of-The-Money (OTM) Put options hoping for a crash. The premium decay (Theta) will kill you while you wait. Instead, use Bear Put Spreads (buying an ATM Put and selling a further OTM Put) to define your risk and lower the cost of the trade.
- Futures with Strict Hedging: If you have the capital, shorting the Nifty Futures gives you pure delta without time decay, but you must buy a far OTM Call option to protect yourself against overnight gap-ups.
Final Thoughts
Major weekly trendline breakdowns don’t happen every month. They might only happen once or twice a year. But as a systematic trader, your job is to preserve your capital during the chop and go aggressive when the structure finally breaks.
Open your charts, switch to the Weekly timeframe, and see where the Nifty is currently sitting. The big picture always tells the truth.