
Decoding Open Interest (OI): How to Spot Institutional Support and Resistance in Nifty Options
If you rely entirely on price charts to trade Nifty 50 options, you are driving with one eye closed.
Price action is incredibly important, but it only shows you the past. If you want to know where the big money—the Foreign Institutional Investors (FIIs) and Domestic Institutional Investors (DIIs)—is currently parked, you have to look at the data they leave behind. That data is called Open Interest (OI).
For a retail options buyer, understanding how to read Open Interest is like having a cheat code for the market. It tells you exactly where the massive brick walls of support and resistance are built. Here is how to decode the Option Chain and trade alongside the institutions instead of against them.
Volume vs. Open Interest: What is the Difference?
Most beginners confuse Volume and OI.
- Volume is the total number of contracts traded during the day. If I buy 1 Call option from you, and then sell it to someone else 5 minutes later, the volume is 2. It resets to zero every morning.
- Open Interest (OI) is the total number of active, open contracts that have not been settled or squared off. It carries over from day to day until expiry.
Why does this matter? Because creating a massive amount of Open Interest requires hundreds of crores of capital. Retail traders do not have that kind of money. Therefore, high OI numbers are the direct footprints of institutional option sellers (Option Writers).
The Option Seller’s Mindset
To read OI correctly, you have to flip your brain upside down and think like an Option Seller.
Option sellers have unlimited risk. If they sell a Call option (CE) at the 22500 strike, they will lose massive amounts of money if the Nifty crosses above 22500. Therefore, if you see an enormous amount of OI at the 22500 CE strike, it means institutions are heavily betting that the market will not cross that level. They will aggressively defend it.
How to Find Your Levels
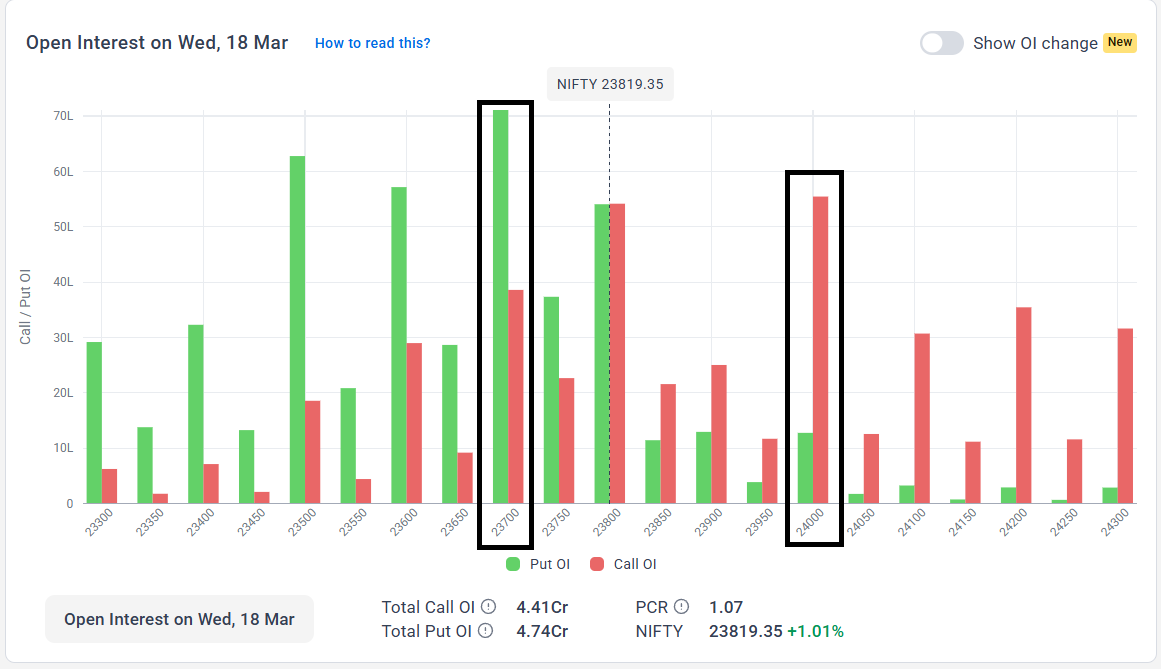
When you open your broker’s Option Chain or a tool like Sensibull around 9:30 AM, ignore the premiums for a second and look at the OI column.
- Major Resistance: Look at the Call (CE) side. Find the strike price with the absolute highest Open Interest. That is your institutional ceiling. If the Nifty approaches this level, expect heavy selling pressure.
- Major Support: Look at the Put (PE) side. Find the strike price with the highest Open Interest. That is your institutional floor. If the Nifty falls to this level, expect strong buying support.
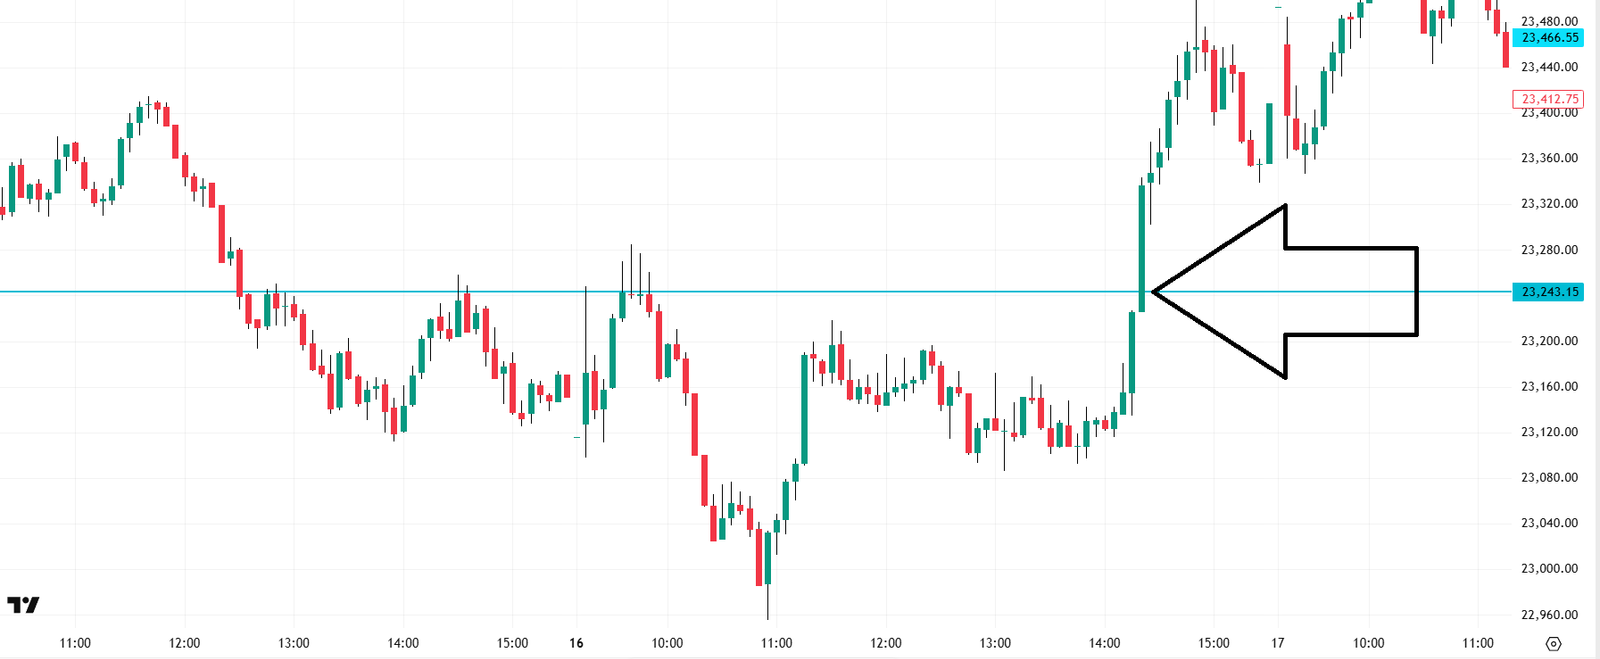
Trading the Breakout (The Short Covering Rally)
So, what happens if the Nifty defies the odds and actually breaks through the strike with the highest Call OI?
Absolute panic.
The institutional sellers who wrote those Calls are now sitting in heavy losses. To close their short positions and protect their capital, they are forced to buy the market. This sudden surge of forced buying is called a Short Covering Rally.
This is the holy grail for intraday options buyers. When a major OI resistance level breaks on the chart, the momentum is violent and fast. Your ATM Call option premium will spike aggressively.
The Daily Routine
Never take a Nifty trade without checking the OI first. If your 5-minute chart shows a breakout, but the Option Chain shows a mountain of Call sellers sitting just 20 points above you, do not take the trade. The probability of it being a fake breakout is huge.
Combine your price action with OI data, wait for the option sellers to get trapped, and ride the momentum when they panic.