
Mastering Pivot Points: How to Catch High-Probability Intraday Reversals
If you use lagging indicators like Moving Averages or MACD, you are always entering the trade late. By the time your EMA crossover tells you to buy a Nifty Call option, the institutions have already pushed the price up 60 points, and you are buying at the exact moment they are taking profit.
To trade the Nifty effectively, you need a Leading Indicator. You need to know where the market is going to reverse before it gets there.
Enter Pivot Points.
This is not a magical crystal ball; it is pure, fixed mathematics used by institutional algorithms around the world to determine daily support and resistance.
What Are Pivot Points?
Unlike an RSI or Moving Average that changes every time a new candle closes, Pivot Points are calculated using the previous day’s High, Low, and Close.
Once the market opens at 9:15 AM, these horizontal lines are drawn on your chart, and they do not move for the rest of the day.
- P (The Pivot): The central magnet of the day.
- R1, R2, R3: Resistance levels above the Pivot.
- S1, S2, S3: Support levels below the Pivot.
Because thousands of algorithmic trading bots are programmed to react at these exact mathematical levels, they act as self-fulfilling prophecies.
The R1 / S1 Reversal Strategy
While Pivot Points can be used for breakouts, they are most powerful for catching intraday reversals.
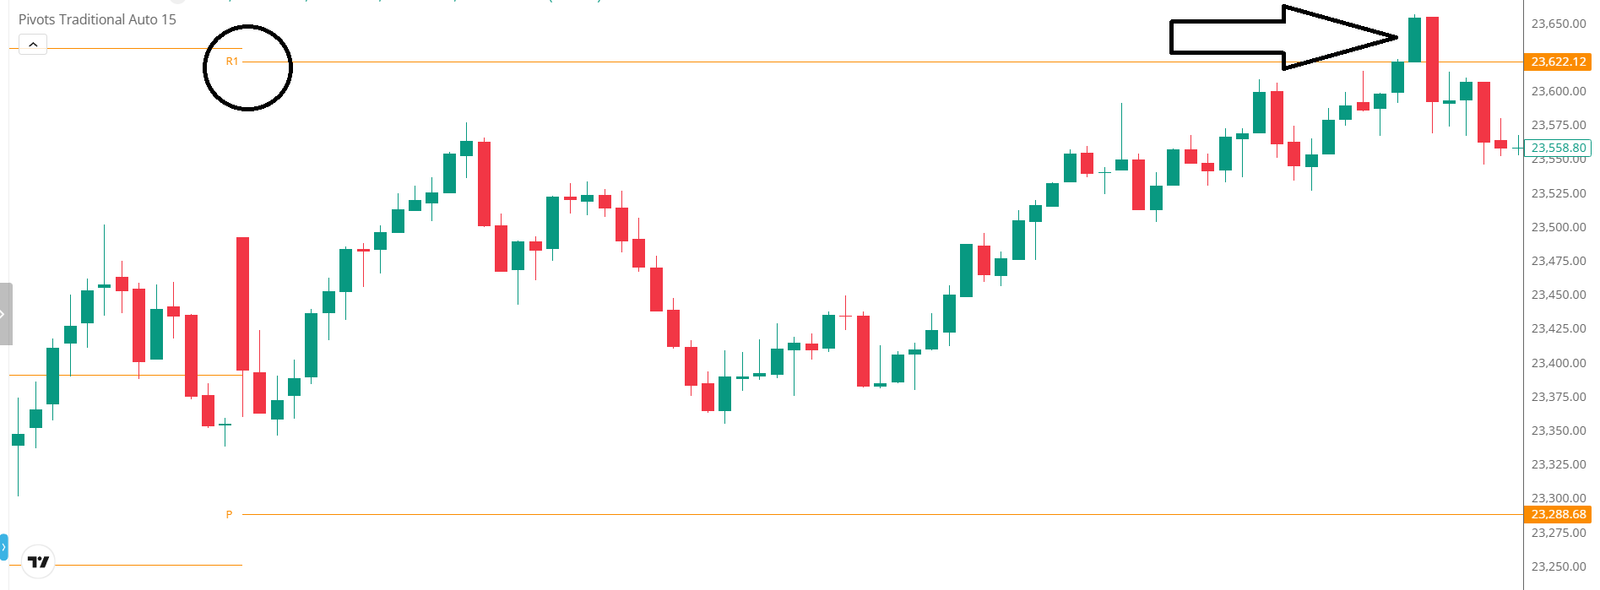
When the Nifty opens and has a massive, aggressive rally straight up to the R1 (Resistance 1) level, amateur traders see the big green candles and buy Calls (CE) out of FOMO (Fear Of Missing Out).
A professional Pivot trader sees the price hitting R1 and starts looking for a shorting opportunity (buying PE). They know that algorithmic profit-booking is highly likely to trigger at this exact line.
How to Execute the Setup:
- The Approach: Watch the Nifty approach a major Pivot (like R1 or R2).
- The Wait: Never blind-buy or blind-sell just because the price touched the line. You must wait for price action confirmation.
- The Trigger Candle: Wait for a bearish reversal candle to form exactly touching the Pivot line. A Shooting Star (a candle with a long upper wick) or a Bearish Engulfing pattern is perfect.
- The Entry: As soon as the next candle breaks the low of your trigger candle, buy your Put option.
- The Target: Your target is simply the next Pivot level down (e.g., if you short at R1, your target is the Central Pivot ‘P’).
The Confluence Filter
To increase your win rate, never use Pivots in isolation. Combine them with data we discussed in previous articles. For example, if the Nifty hits the R1 Pivot Point, AND your Open Interest (OI) data shows massive Call writing at that exact strike price, you have a high-probability “Confluence” setup. The math and the institutional data both agree that a reversal is imminent.
Stop chasing green candles. Plot your Pivot levels before the market opens, wait patiently like a sniper, and take the trade when the market comes to your predefined zones.