
India VIX Explained: Why You Keep Losing Money in Low Volatility Markets
If you have been trading Nifty 50 options for more than a few months, you have probably noticed a strange phenomenon. Some weeks, your breakout strategies (like the ORB) work flawlessly. The market moves 100 points in 15 minutes, and your option premiums double.
Then, the very next week, you use the exact same strategy, the chart looks identical, but the market barely moves. You get stuck in sideways “chop,” and Theta decay slowly eats your capital.
You didn’t do anything wrong technically. You just ignored the most important filter for an options buyer: The India VIX.
If you do not check the India VIX before you take a trade, you are trading blind. Here is how volatility dictates market behavior and how you must adjust your execution based on it.
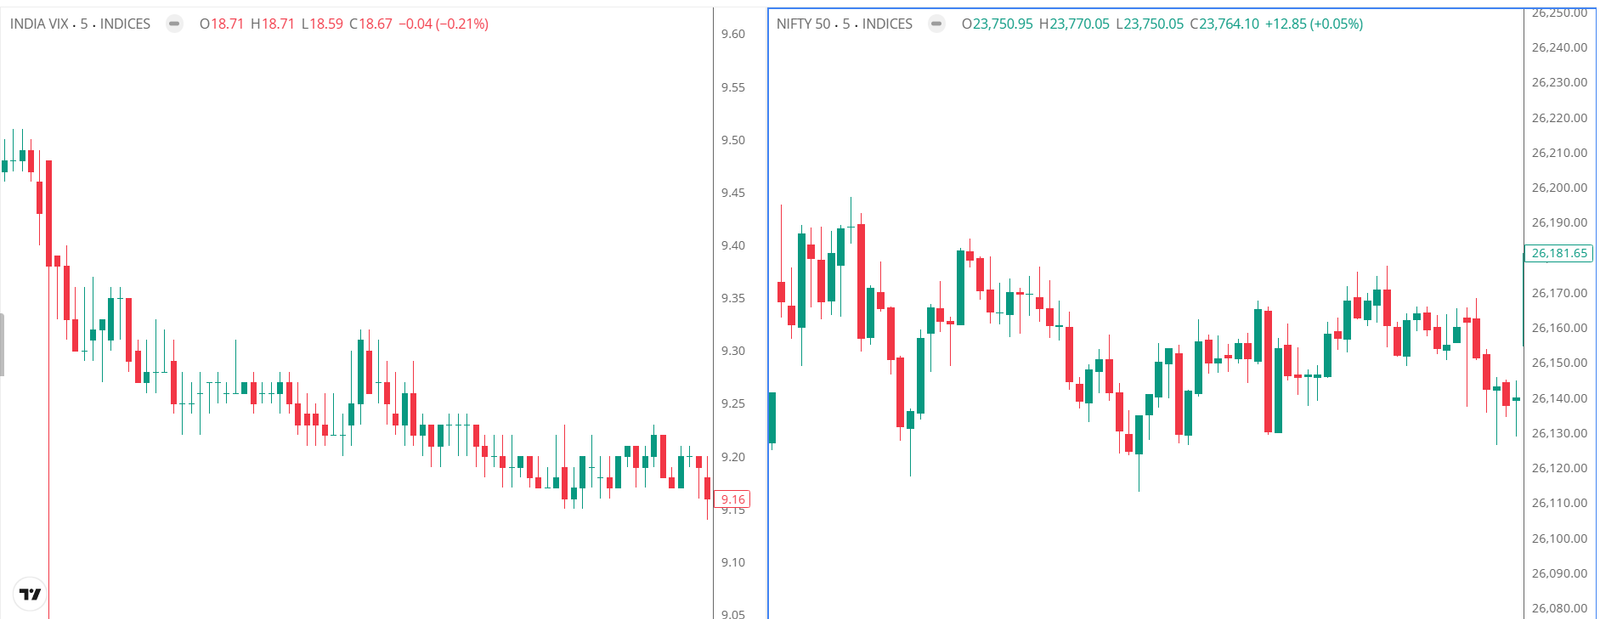
What is the India VIX?
The India Volatility Index (VIX) is often called the “Fear Gauge” of the market. It measures the expected volatility of the Nifty 50 over the next 30 days.
When traders are panicking or expecting a massive event (like the Union Budget or election results), they rush to buy options as insurance. This massive demand drives up the VIX. When the market is calm and trending slowly, the VIX drops.
For a Nifty options buyer, the VIX is your speedometer.
Trading in a High VIX Market (Above 15)
When the India VIX is high, the market moves fast and violently. Support and resistance levels are broken easily.
- The Good News: This is paradise for options buyers. Momentum is aggressive. If you catch a trendline breakdown, the Nifty can swing 150 points in a single hour, giving you massive ROI.
- The Bad News: Because expected volatility is high, option sellers demand higher premiums. The At-The-Money (ATM) Calls and Puts you usually buy for ₹100 might now cost ₹180.
- The Adjustment: In a high VIX environment, you must drastically reduce your position size and widen your stop losses. The candles will be huge, and a normal tight stop loss will get hunted instantly.
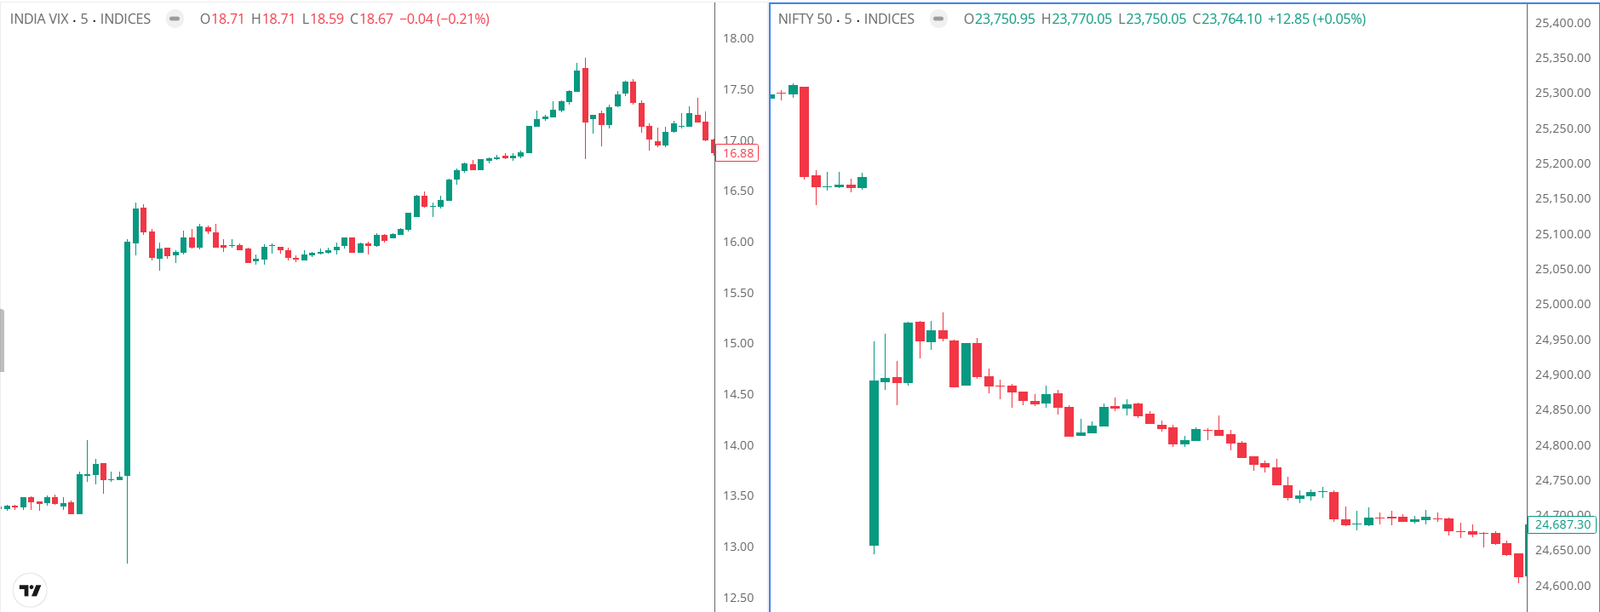
Trading in a Low VIX Market (Below 12)
When the India VIX drops below 12, the market enters “sleep mode.” The institutional algorithms are not aggressively moving large blocks of capital.
- The Reality: Breakouts will fail 70% of the time. The Nifty will break a resistance line by 10 points, suck in retail buyers, and then immediately reverse or go completely flat for three hours.
- The Premium Trap: In a low VIX market, option premiums look incredibly cheap. Beginners see ATM options trading for ₹60 and buy massive quantities. But without volatility, those options will never move in your favor. They will just slowly melt to zero due to time decay.
- The Adjustment: When the VIX is below 12, you must lower your expectations. Change your strategy from “Trend Following” to “Mean Reversion.” Buy at support, sell at resistance, and book your profits incredibly fast. Do not expect 100-point moves.
The Golden Rule
Before you fire a single order in your trading terminal, look at the India VIX. It tells you what kind of pitch you are playing on today. If it is high, play for momentum. If it is low, play defense, scalp quick points, and protect your capital from premium decay.