
The 3:30 PM Routine: How to Analyze End-of-Day (EOD) Data Like a Pro
The stock market officially closes at 3:30 PM. Most retail traders instantly shut their laptops, check their daily P&L, and either celebrate or complain about their losses. They don’t think about the market again until 9:15 AM the next morning.
This is exactly why they fail.
The real work in the financial markets does not happen during live hours; it happens when the market is closed. Professional traders, hedge fund managers, and banking institutions spend their evenings analyzing End-of-Day (EOD) Data. If you want to stop guessing what the market will do tomorrow, you need to build a strict post-market routine.
Here is the exact EOD checklist you should run every day at 4:00 PM.
Step 1: Track the Institutional Money (FII / DII Data)
Retail traders do not move the Nifty 50. Foreign Institutional Investors (FIIs) and Domestic Institutional Investors (DIIs) do. They control the credit, the massive investment portfolios, and the banking sector flows.
Every evening, the NSE releases the provisional cash market data showing whether FIIs and DIIs were net buyers or net sellers.
- Did the market go up today, but FIIs actually sold ₹3,000 Crores in the cash market? That tells you today’s rally might have been a fake short-covering bounce, not a real trend.
- Are FIIs heavily buying index futures while selling index options? They are hedging for a massive move.
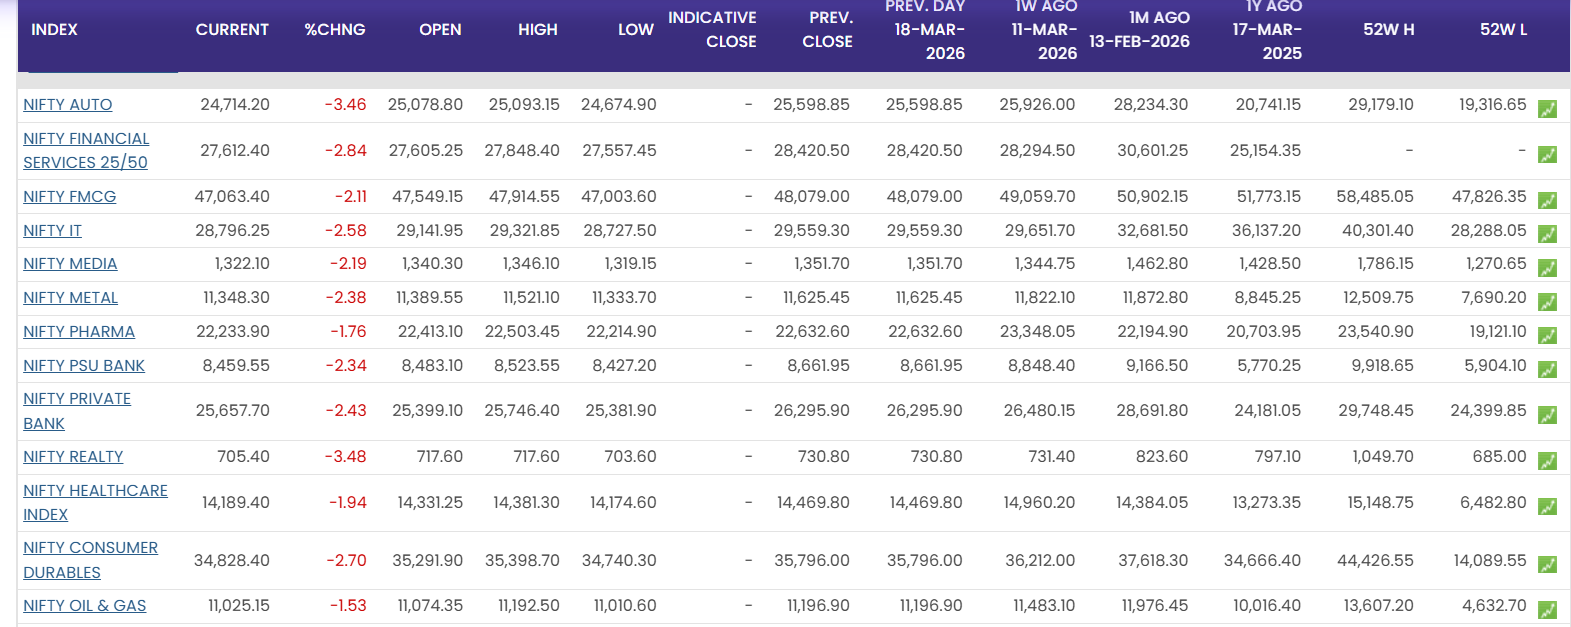
Step 2: Sectoral Heatmap Analysis
Never look at the Nifty in isolation. The Nifty is an average of different sectors. You need to know which gears are turning the machine.
Pull up an EOD sectoral chart.
- Did the Nifty close flat, but the IT Sector was up 2% while the Banking Sector was down 2%?
- This tells you exactly what to trade tomorrow. If global markets are weak overnight, you know the banking sector is already bleeding, making Bank Nifty the perfect candidate for Put (PE) options the next morning.
Step 3: EOD Option Chain Review
During live market hours, Open Interest (OI) fluctuates wildly. But the End-of-Day Option Chain tells you exactly where the big option writers are sleeping tonight.
Look at the closing OI for the upcoming weekly expiry.
- Where is the highest Call OI? That is your unbreakable resistance for tomorrow.
- Where is the highest Put OI? That is your concrete support. Draw these exact levels on your daily chart right now, so you aren’t scrambling to find them at 9:15 AM tomorrow.
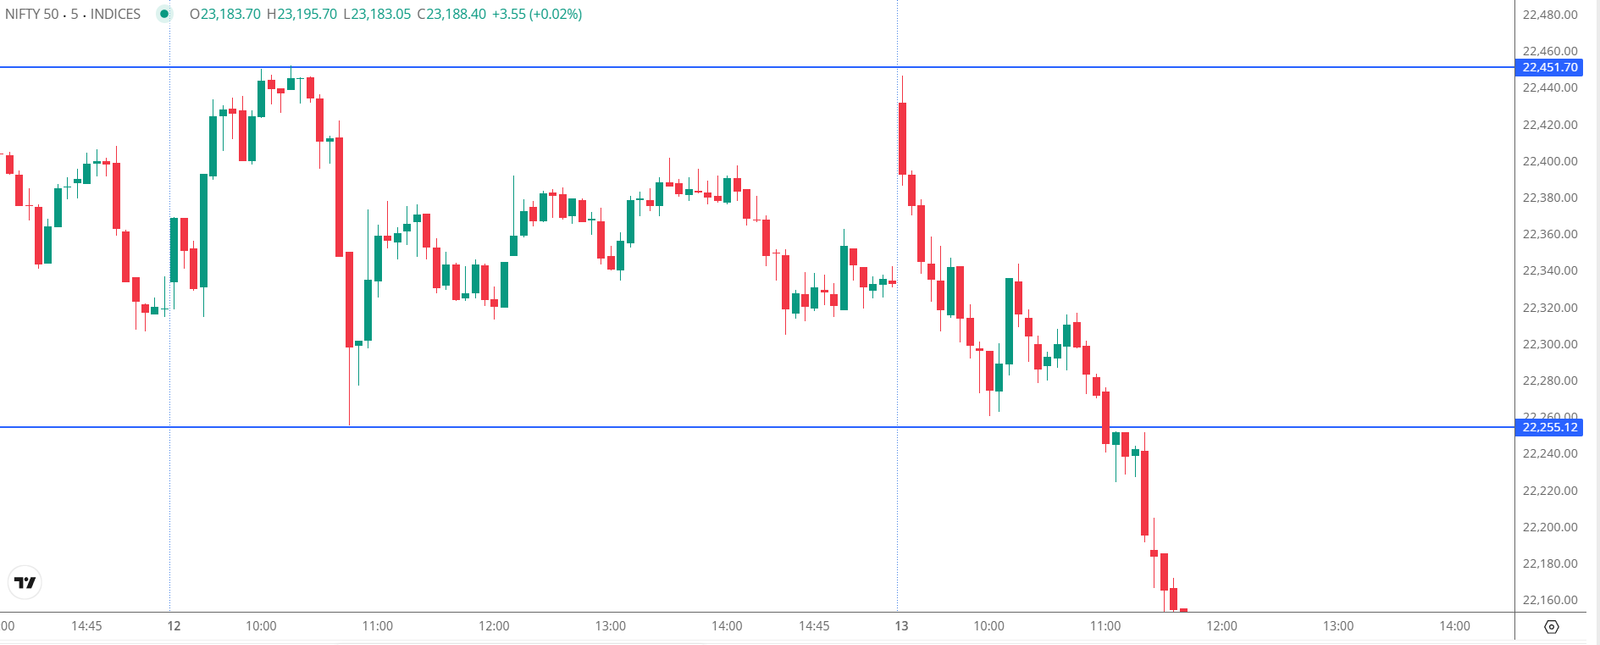
Step 4: Charting the Daily Candle
Finally, zoom out. Open the Daily timeframe chart for Nifty and Bank Nifty.
- Did today’s candle close above yesterday’s high?
- Did it form a massive rejection wick at a major historical level?
- Where is the nearest liquidity gap?
The Ultimate Benefit
When you do your EOD analysis, you wake up the next morning with a trading plan. If the market gaps up, you already know where the resistance is. If it crashes, you know which sector is weakest. You stop reacting with emotion and start executing like a professional finance manager.
Do the homework. The profits will follow.