

Indicator Overload: How to Declutter Your TradingView Setup
We have all been there. You discover a new YouTube video claiming to have the “100% Win Rate Holy Grail Strategy.” You open your TradingView, add a 9 EMA, a 15 EMA, the MACD, the RSI, Bollinger Bands, and a stochastic oscillator.
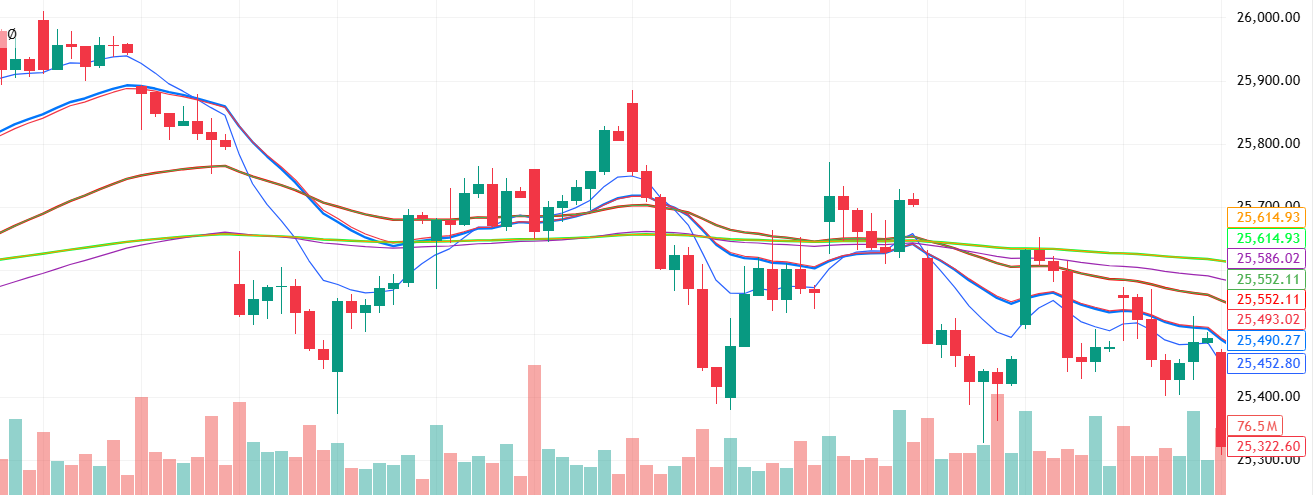
Suddenly, your Nifty 50 chart looks like a glowing Christmas tree. You can barely even see the actual red and green candles anymore.
This is called Indicator Overload, and it is one of the fastest ways to destroy your trading psychology. Let’s talk about why having too many indicators actually makes you a worse trader, and exactly how to clean up your screen so you can finally see the market clearly.
The Problem: Conflicting Signals
The biggest danger of indicator overload is “analysis paralysis.” When you are scalping Nifty weekly options, you have to make decisions in a fraction of a second.
If you have six indicators on your chart, they will almost never agree with each other.
- Your 9 EMA just crossed above your 15 EMA (Buy Signal).
- But your RSI is at 75, which means it is “Overbought” (Sell Signal).
- But the price is touching the top of the Bollinger Band (Sell Signal).
- But the MACD histogram is growing green (Buy Signal).
What do you do? You hesitate. You freeze. By the time you finally decide to click “Buy Call (CE),” the Nifty has already spiked 40 points, and you end up buying at the absolute top.
The Rule of Non-Correlation
You do not need six indicators. You only need two or three, but they must measure different things. Most beginners stack indicators that do the exact same job. For example, RSI, MACD, and Stochastic are all momentum oscillators. If one is going up, the others are generally going up too. Having all three on your chart is like having three speedometers in your car—it doesn’t make you drive any faster; it just takes up space.
To declutter, you should only pick one tool from each category:
- Trend & Dynamic Support: Pick one (e.g., VWAP, Supertrend, or a single Moving Average).
- Momentum: Pick one (e.g., RSI or MACD).
- Volume: Pick one (e.g., standard Volume bars at the bottom).
Price Action is the Ultimate Indicator
Every single indicator (except volume) is a “lagging” indicator. They are calculated using the open, high, low, and close of past candles. That means the indicator is always a step behind the actual market.
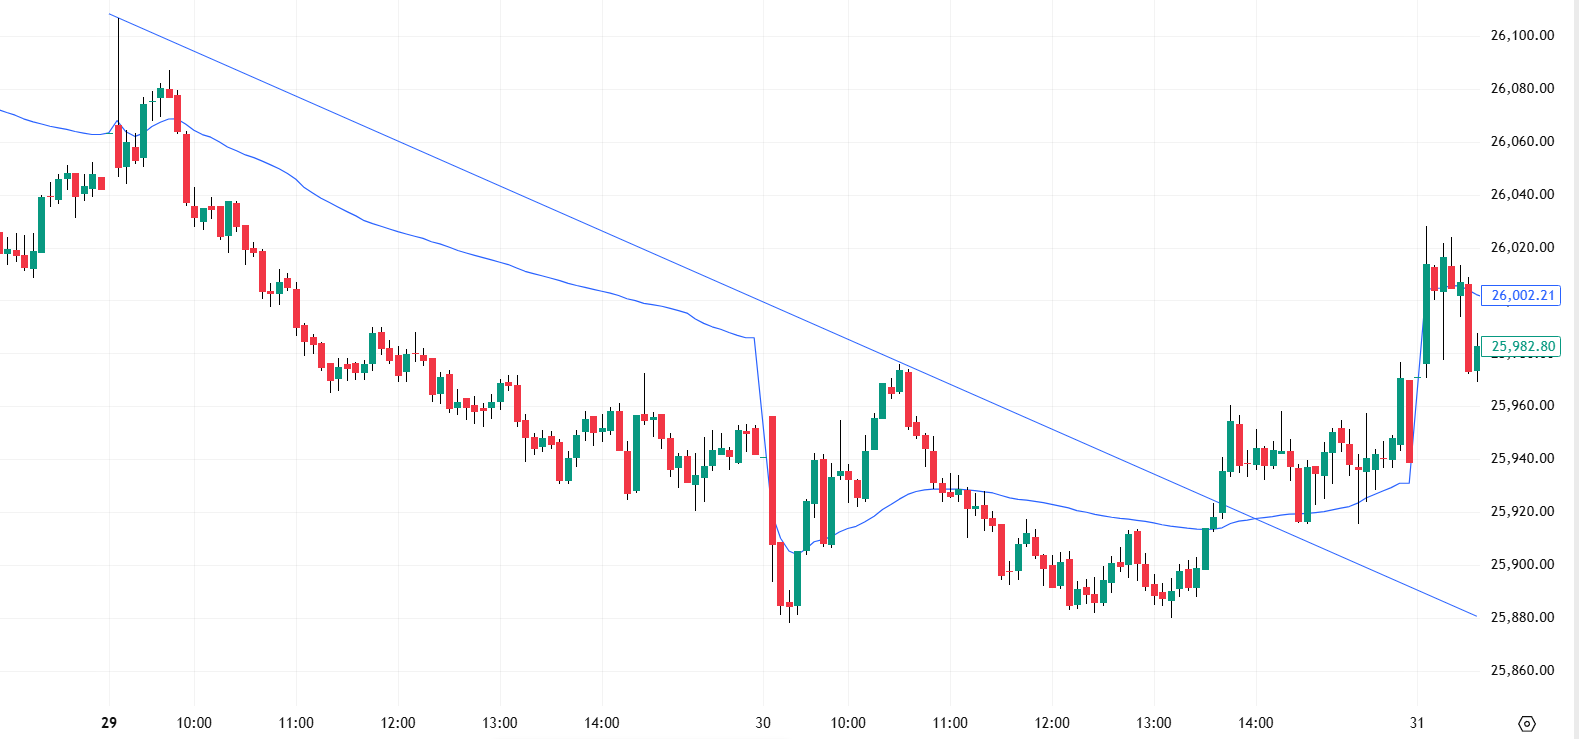
The only “leading” indicator is Price Action itself. Before the RSI turns, and before the MACD crosses, the actual candlestick structure changes. A major long-term weekly trendline breaking, or a strong Opening Range Breakout (ORB), will tell you more about institutional money flow than any colorful line on your screen.
The Fix: Consolidate or Delete
If you truly feel you need multiple data points to enter a trade, stop putting them all visually on the chart.
As we discussed in a previous article, you can use Pine Script to combine your favorite conditions (like VWAP, EMAs, and RSI) into a single custom script. Let the code do the math in the background, and just have it print a simple “Buy” or “Sell” arrow on a naked chart.
Professional traders have incredibly boring, simple charts. Strip away the noise, focus on the price, and watch how much faster your execution becomes.