
Market Breadth Explained: The Secret that Proves if a Breakout is Real
You have seen this happen a hundred times. The Nifty 50 breaks a major daily resistance line. The candle closes green. Your indicators are all flashing “Buy.” You enter the trade, but immediately the index stalls, reverses, and crashes right back through the support line.
You sit there wondering, “Why did the breakout fail? The chart was perfect.”
The chart failed because the Nifty 50 is a liar. It is a weighted index, meaning just one or two massive companies (like Reliance or HDFC Bank) can artificially hold the index up, making it look like a breakout, even if the rest of the market is secretly bleeding.
If you want to know if a Nifty breakout is genuine, you have to look past the top 5 heavyweights. You have to measure the pulse of the entire stock market. This is called Market Breadth, and it is the ultimate filter for fakeouts.
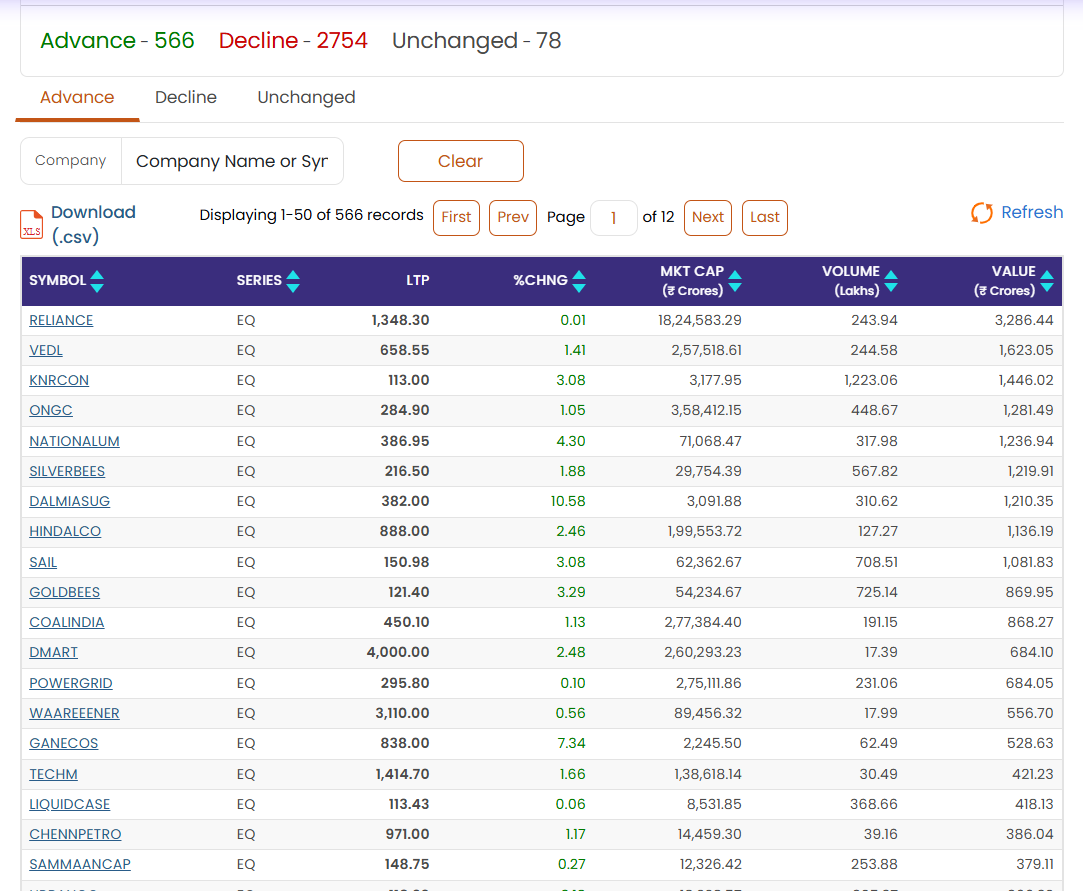
What is the Advance/Decline (A/D) Ratio?
Market Breadth is measured using the Advance/Decline (A/D) Ratio. It is an incredibly simple but powerful calculation:
Number of Advancing Stocks (Green) ÷ Number of Declining Stocks (Red)
Instead of just looking at the Nifty 50, professional traders look at the broader Nifty 500 or the total NSE listed stocks to see the underlying health of the financial market.
- If 1,500 stocks are advancing and only 500 are declining, the A/D ratio is 3:1. This is massive, widespread buying.
- If 400 stocks are advancing and 1,600 are declining, the market is structurally weak, no matter what the Nifty 50 chart looks like.
Spotting the Ultimate Bear Trap
Let’s go back to that fake breakout scenario.
Imagine the Nifty 50 chart is pushing up and breaking resistance. Before you buy that Call (CE) option, you check the NSE Advance/Decline data. You see that only 15 out of the 50 Nifty stocks are in the green, and in the broader market, 1,200 stocks are in the red.
- The Reality: The broader market is crashing. The only reason the Nifty 50 is breaking out is because Reliance Industries announced positive news and is up 4% alone, dragging the weighted average up with it.
- The Action: You immediately cancel your buy order. You know that a breakout cannot survive if 70% of the market is selling off. You just saved yourself from a massive bear trap.
The Confirmation Trade
Market breadth is not just for avoiding traps; it is the ultimate green light for scaling up your position size.
If the Bank Nifty is breaking out of a tight consolidation box at 10:00 AM, and you check the sectoral breadth and see that 11 out of the 12 Bank Nifty components are green, you have a High-Probability Alignment.
The move is not being faked by just HDFC Bank; the entire financial sector is experiencing institutional cash flow. When you see this kind of massive, widespread participation, you can confidently hold your winning trade longer and aim for a 1:3 or 1:4 Risk-to-Reward ratio.
Stop trading the index in isolation. The Nifty is just a mirror reflecting the health of its underlying stocks. Check the Advance/Decline ratio every morning at 9:30 AM, and never trade against the true momentum of the broader market.