
Mean Reversion Trading: Concepts and Strategy
The financial markets spend roughly 70% to 80% of their time chopping in a sideways range.
If you only know how to trade trendline breakouts, you are going to spend 80% of your time losing money to fake-outs and Theta decay. To survive the Indian options market, you need a strategy for the boring days. You need to understand Mean Reversion.
What is Mean Reversion?
The market is like a rubber band attached to an anchor. That anchor is the “Mean” (the average price).
When massive momentum hits, the Nifty stretches far away from its average. But eventually, the institutional buying pressure dries up, the rubber band reaches its maximum tension, and the price snaps violently back to the anchor.
Mean Reversion is the strategy of identifying when the market is over-stretched and betting on that snap-back.
The Ultimate Anchor: The VWAP
For intraday trading, the Volume Weighted Average Price (VWAP) is your anchor. It represents the true, volume-adjusted average price that institutions have paid for the asset that day.
When the Bank Nifty rallies 200 points in a straight line at 9:30 AM without a single red candle, it leaves the VWAP far behind. By 10:30 AM, the algorithmic bots look at the price, realize it is wildly overextended compared to the day’s average volume, and begin taking profits.
The price then inevitably drifts back down to “touch base” with the VWAP.
How to Trade the Snap-Back
Trading mean reversion requires extreme patience because calling a “top” or a “bottom” is dangerous. Here is the safest systematic approach:
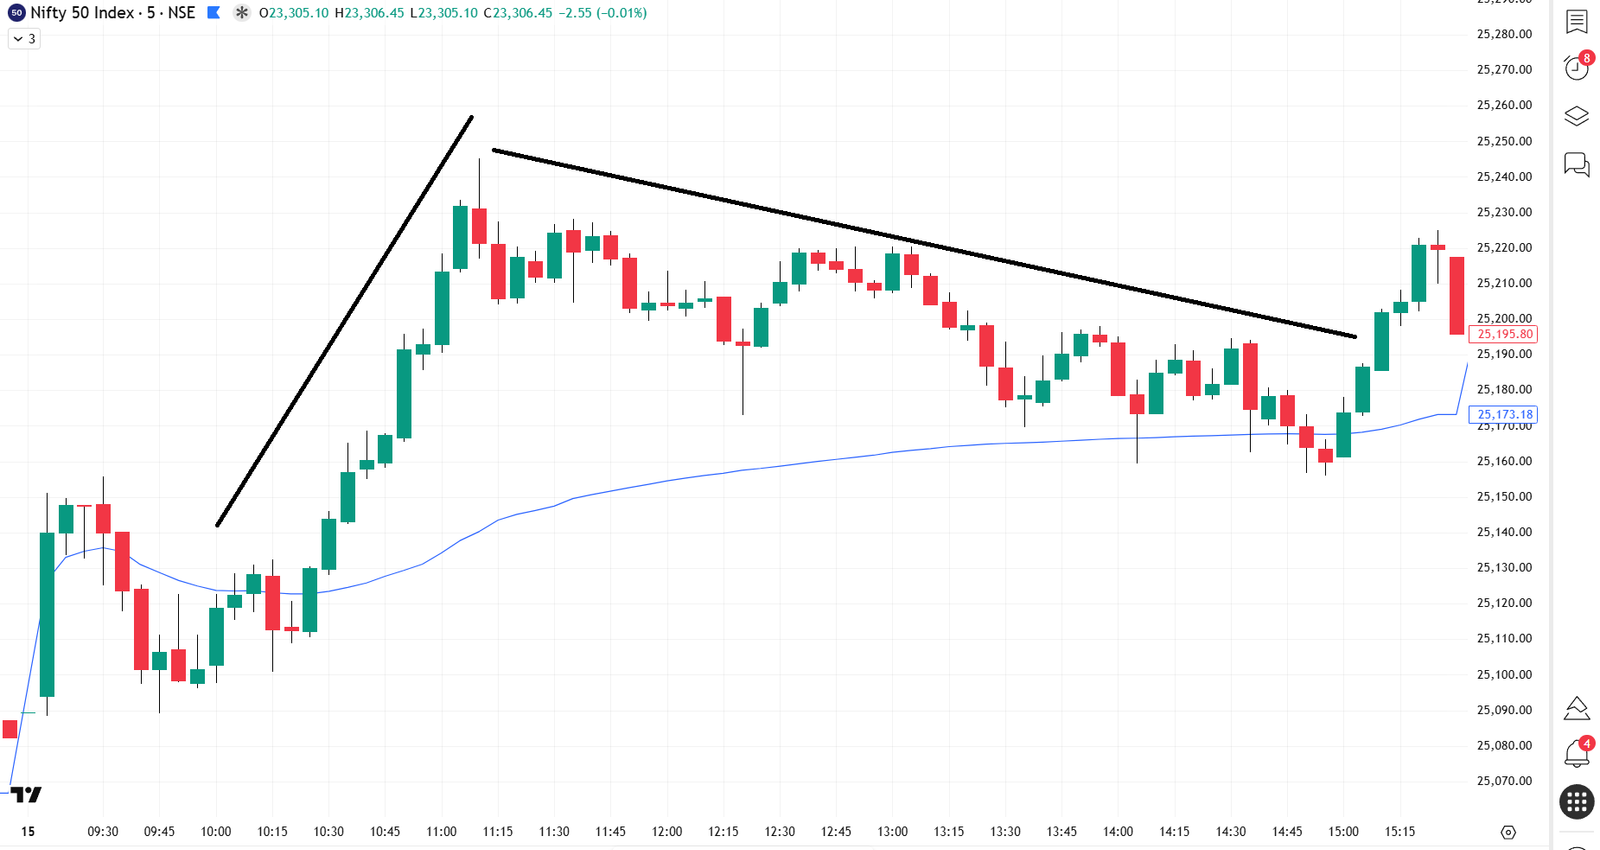
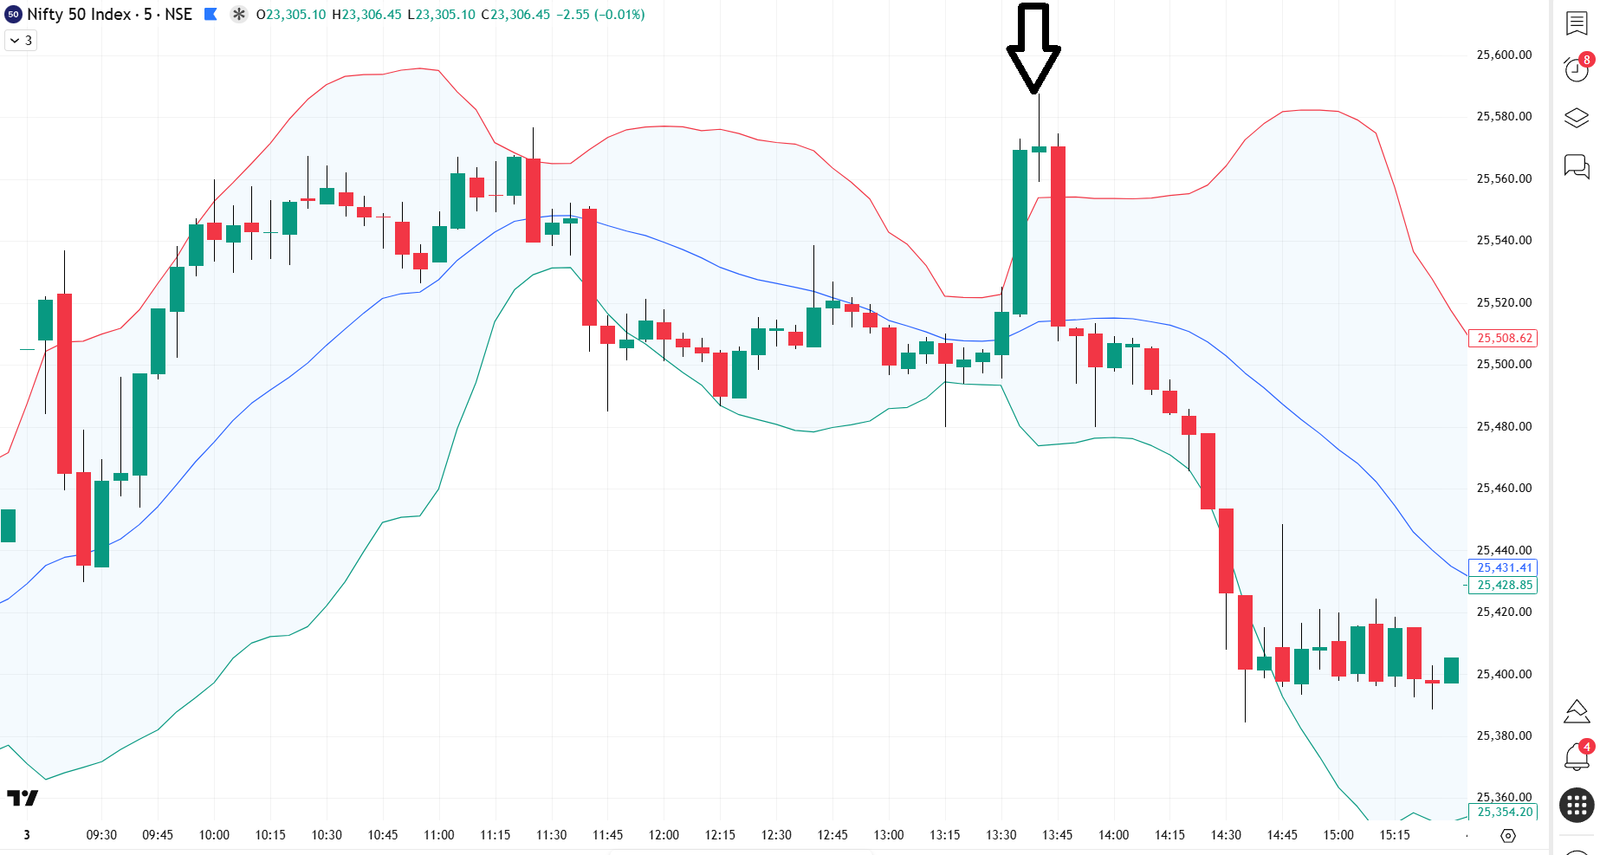
- Identify the Stretch: Wait for the Nifty or Bank Nifty to move rapidly away from the VWAP. Use standard deviation tools like Bollinger Bands. If the price pierces the Upper Bollinger Band while the VWAP is far below, the rubber band is fully stretched.
- Look for Exhaustion: Never short a massive green candle. Wait for the momentum to die. Look for the candlestick patterns we discussed earlier—like a massive Pin Bar rejection or a Bearish Engulfing candle—printing outside the Bollinger Band.
- The RSI Divergence: This is your final confirmation. If the price makes a higher high, but your RSI (Relative Strength Index) makes a lower high, the momentum is officially dead.
- The Target: You buy the Put (PE) option. Your stop loss is just above the high of the rejection wick. Your exact, non-negotiable target is the VWAP line. Once it touches the VWAP, you exit entirely.
The Options Selling Advantage
If you have the capital, Mean Reversion is actually the perfect environment for Option Selling (Writing).
When the market is stretched and the RSI is overbought, the Call premiums are heavily inflated due to fear and momentum. Instead of buying a Put and fighting Theta, professional mean reversion traders simply sell the Out-Of-The-Money Call options. Even if the Nifty doesn’t crash back to the VWAP, but just goes sideways and chops around, the Option Seller still makes a massive profit purely from time decay.
Stop forcing breakouts in a sideways market. Learn to read the stretch, wait for exhaustion, and trade the rubber band.