
Order Flow Trading: How to Read Bid-Ask Data Like Institutional Traders
If you are trying to day-trade the Nifty or Bank Nifty using only standard candlestick charts, you are looking in the rearview mirror.
A candlestick only tells you what happened after the transaction was completed. It shows you the past. But in the high-stakes world of modern finance, major banking institutions and hedge funds do not trade based on the past. When they invest hundreds of crores into the market, they rely on the raw, live data of the present moment.
They look at the order book. They track the exact number of buyers and sellers colliding in real-time. This is called Order Flow Trading, and if you want to stop getting trapped by fake breakouts, you need to learn how to read the Bid-Ask data like the professionals.
The Illusion of the Price Chart
Retail traders are taught to look at support and resistance lines. But a line on a chart cannot stop the price from falling. Only a massive wall of buy orders can stop the price from falling.
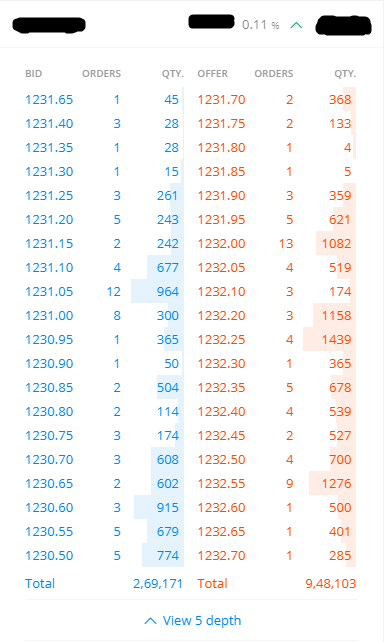
Order flow removes the illusion of the chart and lets you look directly into the market’s engine room. It shows you the Depth of Market (DOM)—the exact number of pending limit orders sitting at every single price level.
- The Bid: Buyers waiting to purchase the asset.
- The Ask (Offer): Sellers waiting to offload the asset.
When you learn to read the collision between the Bid and the Ask, you stop guessing whether a breakout is real, and you start seeing the actual money moving.
Spotting the Institutional “Iceberg”
When a major investment firm wants to buy 1,00,000 shares of HDFC Bank or massive lots of index futures to act as a portfolio insurance policy, they have a major problem. If they place that massive order all at once, the algorithm bots will see it, panic, and push the price up before the order fills, ruining their average entry price.
To hide their intentions, institutions use Iceberg Orders. They slice their massive 1,00,000 order into tiny, invisible chunks. They might only show 500 quantities on the Bid. But every time retail traders sell 500 quantities to them, the Bid instantly magically reloads with another 500.
- How to Trade It: If you are watching the order flow tape and you see the Bank Nifty dropping, but the price hits a specific level and completely freezes—and you see massive selling volume coming in, but the price refuses to drop a single tick—you have spotted an Iceberg. A major institution is absorbing all the selling pressure. This is your signal to buy the Call option and ride the reversal alongside the smart money.
The “Spoofing” Trap
Because institutions have access to massive credit lines and margin leverage, they can easily manipulate the order book to trap retail traders. This illegal but highly common tactic is called Spoofing.
Here is how it works:
- The institution wants to sell the Nifty at a high price.
- To trick retail traders into pushing the price up, the institution places a massive, fake “Buy” order (Bid) 20 points below the current price.
- Retail traders look at the DOM, see that massive wall of buying support, and aggressively buy the market, thinking it is safe.
- The moment the price reaches the institution’s true target, they execute their real Sell orders, and instantly cancel the fake Buy order. The “support” vanishes into thin air, and the market crashes, trapping the retail buyers.
Delta and Aggressive Execution
In order flow, there are passive traders (Limit Orders) and aggressive traders (Market Orders).
The market only moves when aggressive traders are willing to cross the spread and hit the Ask (buy at market) or hit the Bid (sell at market). The difference between aggressive buying and aggressive selling is called Order Flow Delta.
If the Nifty is breaking out of a trendline, but your Order Flow Delta is actually negative (meaning more people are aggressively hitting the Bid to sell), the breakout is a complete fake. The chart is lying to you.
Stop relying purely on shapes and lines. When you start tracking the actual volume and liquidity at the Bid and Ask, you align your capital with the institutions controlling the market.