

The Ultimate Custom Indicator: Combining VWAP, Supertrend, and RSI in Pine Script
Open the TradingView chart of any beginner retail trader, and you will usually see a complete mess. You will find three different moving averages, a MACD at the bottom, Bollinger Bands squeezing the price, and a stochastic oscillator tangled up in the corner.
This is called “Indicator Overload.” When you have six different lines on your chart, you end up with “analysis paralysis.” The MACD says buy, but the Bollinger Band says sell. You hesitate, miss the Nifty breakout, and watch the premium spike without you.
If you are serious about systematic trading, you need clean charts. And the best way to get a clean chart on TradingView is to write your own custom Pine Script that combines your favorite indicators into one single, clear signal.
Here is how and why you should combine VWAP, Supertrend, and RSI into a single custom script for Nifty options.
The Logic: Why These Three?
A good systematic trade requires three things: Institutional confirmation, trend direction, and momentum.
- VWAP (Volume Weighted Average Price): This is the intraday institutional anchor. Large players (FIIs/DIIs) use VWAP to ensure they are getting a fair average price. If the Nifty is trading above the VWAP, the intraday structure is bullish. If it is below, it is bearish.
- Supertrend: This is your visual trend follower and trailing stop loss. It uses the Average True Range (ATR) to calculate market volatility and prints a green or red cloud behind the price.
- RSI (Relative Strength Index): This is your momentum gauge. We don’t just use it for “overbought” or “oversold.” We use it to measure strength. An RSI above 50 indicates the bulls are in control.
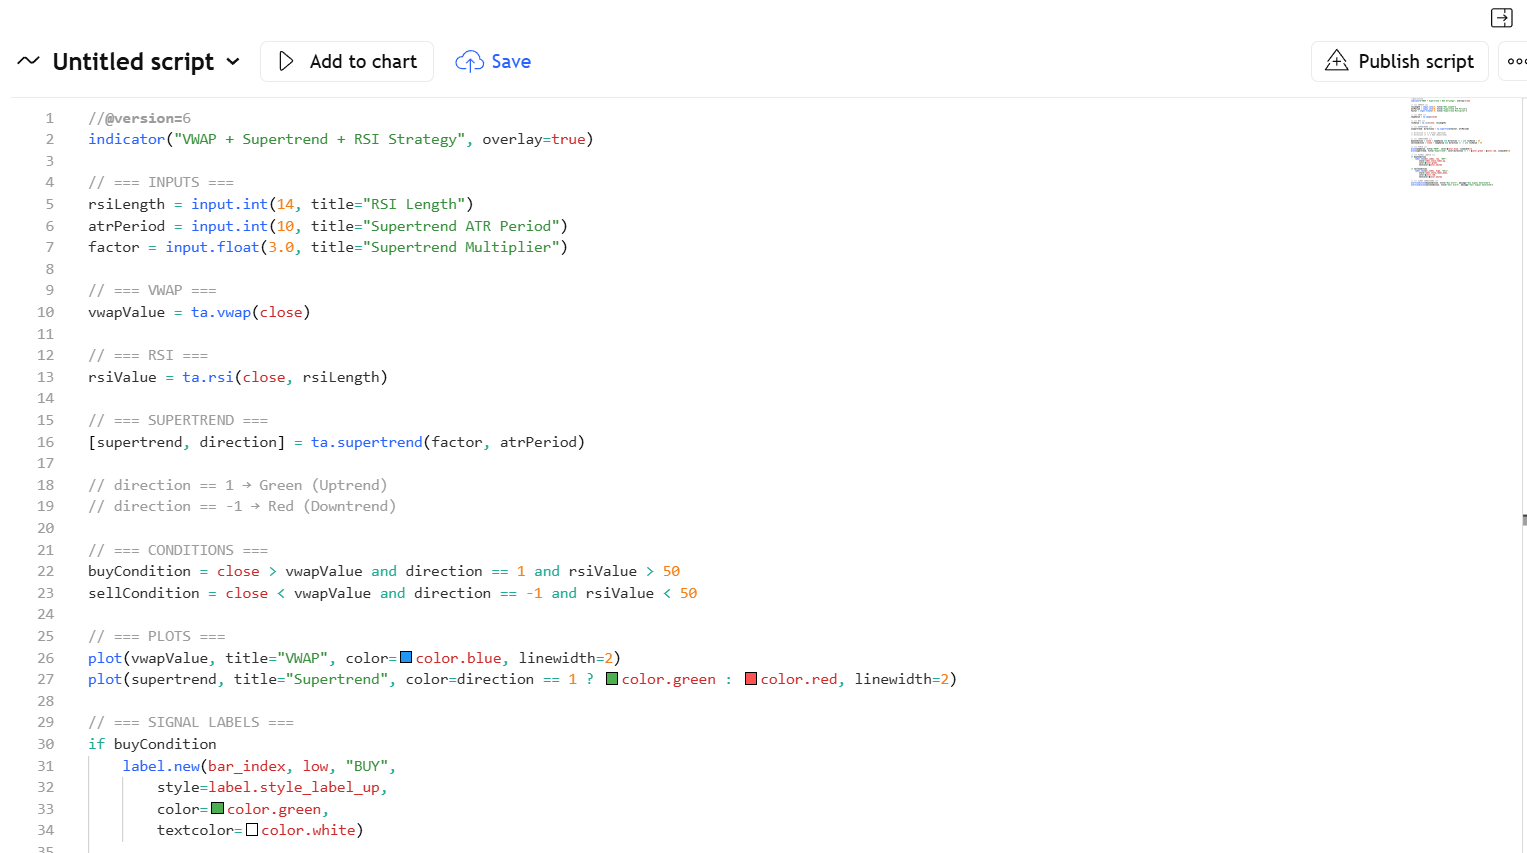
Building the Custom Pine Script
Instead of looking at three different visual tools, we can write a simple Pine Script that only paints a “Buy” signal when all three conditions align perfectly.
Here is the basic logic you would code into the TradingView editor:
- Buy Condition:
Close > VWAPANDSupertrend == GreenANDRSI > 50 - Sell Condition:
Close < VWAPANDSupertrend == RedANDRSI < 50
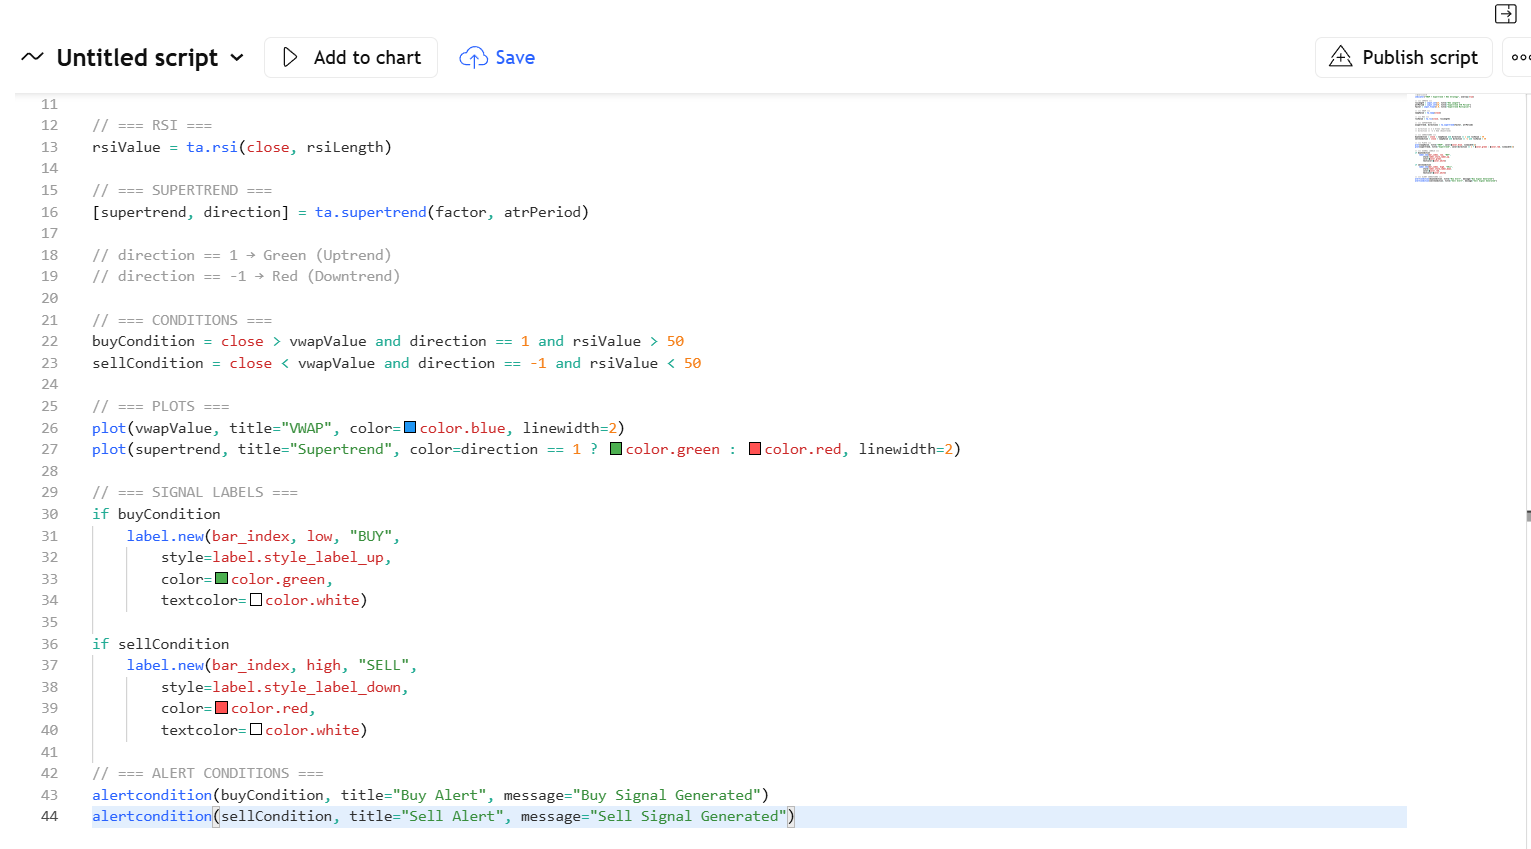
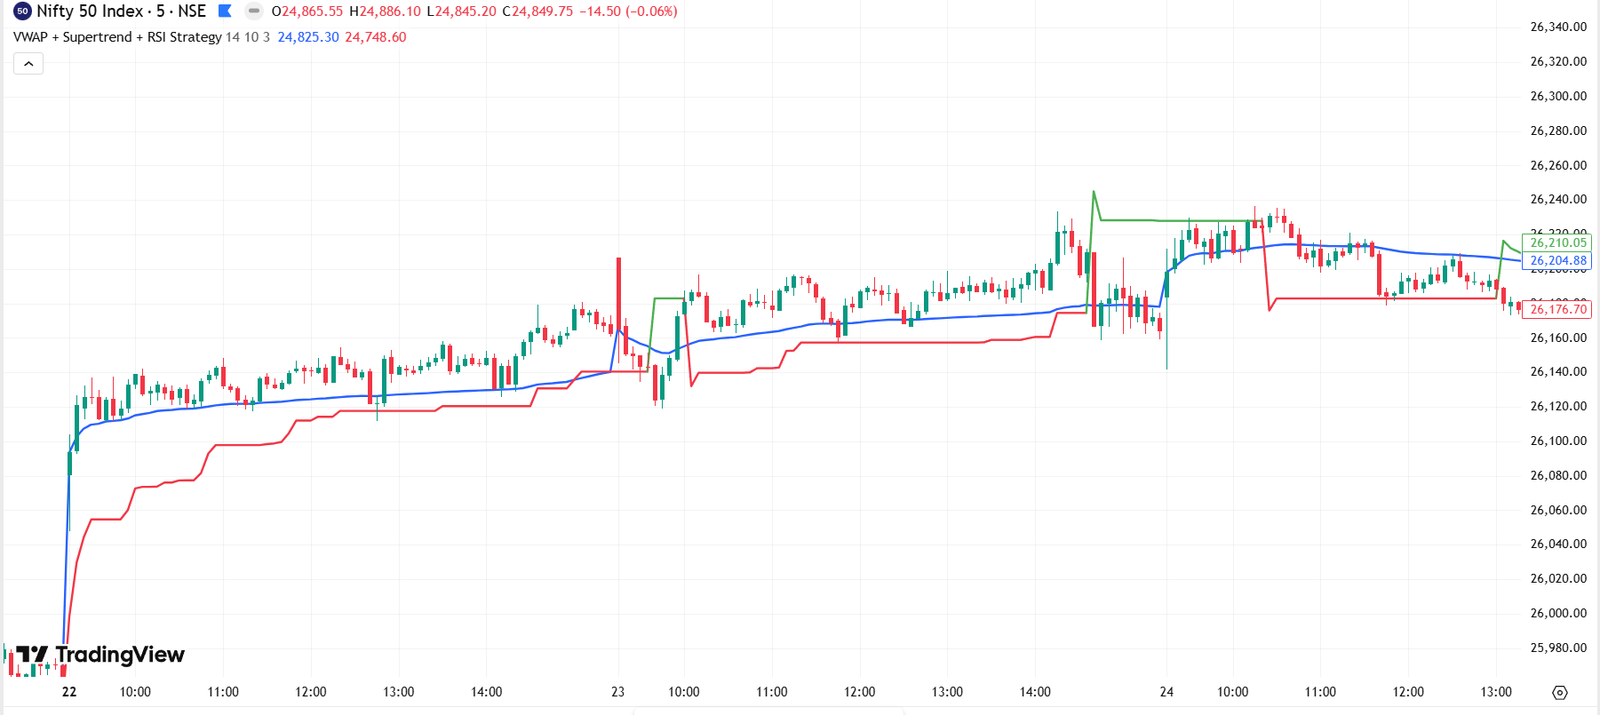
When you compile this script, your messy chart transforms. You can hide the standard indicators and just tell your script to paint a Green Arrow below the candle when all three conditions are met.
Scaling Up: The Power of Custom Systems
Once you master combining three basic indicators, the sky is the limit for your trading software.
You could easily expand this logic to combine MACD, Bollinger Bands, EMAs, and Pivot Points. You might even create a master “7 Horses” strategy script—a heavy-duty indicator that requires seven different technical conditions to align before giving you that one high-probability entry signal.
The Ultimate Benefit: Emotionless Trading
The greatest advantage of writing your own Pine Script indicator isn’t just a clean chart; it is the removal of human emotion.
When the green arrow prints, you buy the Call option. You don’t guess, you don’t hesitate, and you don’t over-analyze the news. You trust the math, execute your predefined risk management, and let the system do the heavy lifting.
If you want to survive the Indian stock market, stop cluttering your screen and start coding your edge.