
Trap Trading: How to Identify and Trade Fake Breakouts on Expiry Day
It is the most frustrating feeling in the world. You wait patiently for the Nifty to form a perfect resistance line. A massive green candle breaks out above the line. You buy your Call (CE) option, expecting a massive rally.
But the very next candle reverses. It wipes out the breakout, crashes below the trendline, hits your stop loss, and ruins your entire trading day.
You weren’t wrong about the market moving—you just fell into a Bull Trap. In the Indian stock market, especially on weekly expiry days, institutional algorithms are actively hunting retail liquidity. If you do not know how to spot a fake breakout, you will become their liquidity. Here is how to identify traps and flip the script to profit from them.
The Logic of the Trap (Liquidity Sweeps)
Institutions need massive amounts of volume to fill their orders. If a big player wants to short the Nifty, they need retail traders to be aggressively buying.
How do they trick retail traders into buying? By pushing the price just above a major resistance level.
Retail breakout traders see the line cross, they jump in with market orders, and the institutions happily sell into that buying frenzy. Once the institutional orders are filled, the buying support vanishes, and the price collapses.
The Ultimate Filter: The Candle Close and the Wick
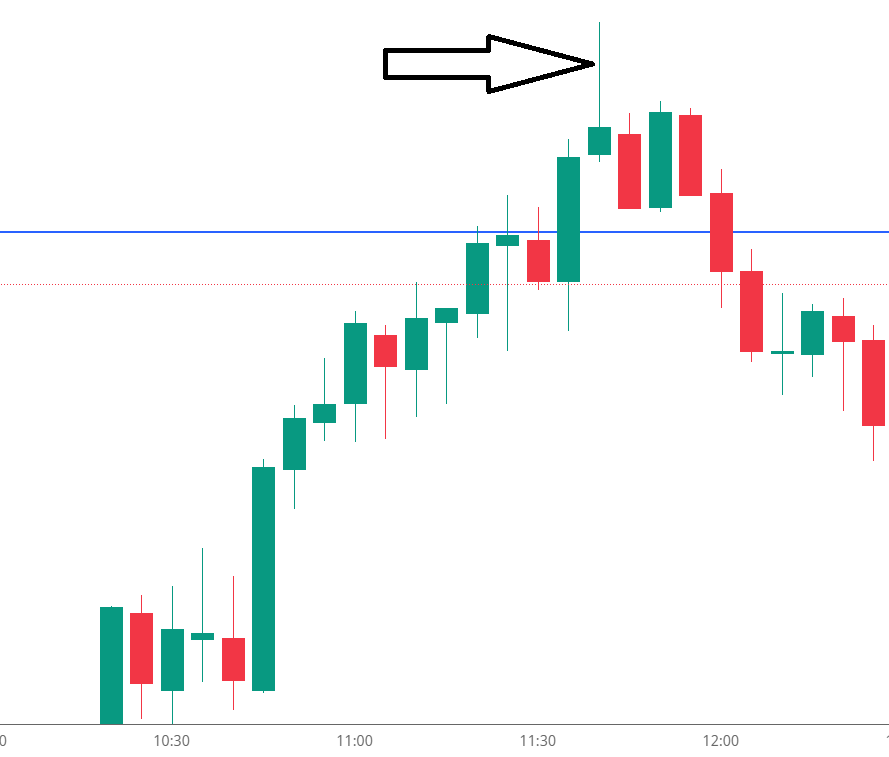
The biggest mistake retail traders make is buying a breakout while the 5-minute candle is still forming.
During the first 3 minutes of a candle, it might look like a massive, undeniable green breakout. But by the 5th minute, heavy selling pressure steps in, pushing the price all the way back down.
When the 5-minute candle finally closes, what looked like a solid green body is now just a massive rejection wick sticking out above your resistance line. That long wick is the visual footprint of a trap. It proves that the breakout was rejected.
How to Trade the Reversal
Once you spot a trap, the psychology of the market completely shifts. All the retail traders who bought that fake breakout are now trapped in losing positions. Where are their stop losses? Safely tucked below the recent swing low.
As a trap trader, you use their pain to your advantage.
The Strategy:
- Identify the Level: Mark a clear intraday high, low, or major trendline.
- Wait for the Sweep: Watch the price break the level, but do not enter.
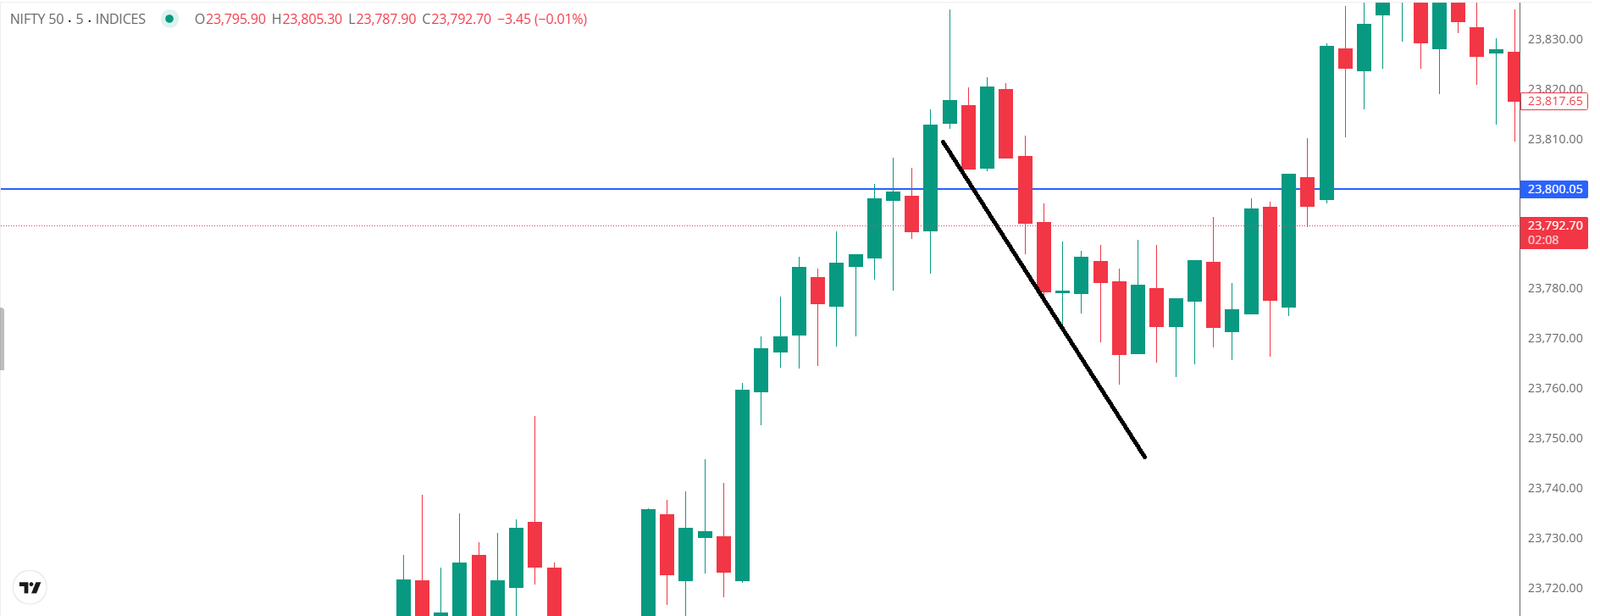
- The Confirmation: Wait for the candle to close back inside the range, leaving a large wick (like a shooting star at resistance, or a hammer/tweezer bottom at support).
- The Entry: The moment the next candle breaks the low of that rejection wick, you aggressively enter in the opposite direction (e.g., Buy a Put option).
- The Target: Your target is the opposite side of the day’s range, where all the trapped buyers’ stop-losses are waiting to be hit.
Patience Pays
The market spends 70% of its time chopping around and faking people out. You don’t have to trade every single line break. Let the amateurs rush in and provide liquidity. Wait for the candle to officially close, analyze the wicks, and only strike when you see the trap snap shut.