
The Power of Historical Data: Why Backtesting is the Only Way to Generate Consistent Income
Let me ask you a very direct question: If you take a trade today based on a 15-minute trendline breakout, do you actually know the mathematical probability of that trade winning?
If your answer is, “Well, it looked good on the chart,” or “A YouTuber said it works,” you are not trading. You are gambling.
The harsh reality of the Indian stock market is that 90% of retail options buyers lose money. They lose because they trade on gut feeling, emotion, and incomplete information. The 10% who actually generate consistent, active income all have one thing in common: They rely heavily on historical data and rigorous backtesting.
Here is why backtesting is the ultimate separator between amateurs and professionals, and how you can start doing it today.
The Illusion of “Screen Time”
Many beginner traders believe that if they just stare at the Nifty 50 chart from 9:15 AM to 3:30 PM every day, they will magically develop a “feel” for the market.
While screen time helps you navigate your broker terminal, human memory is horribly flawed. We suffer from confirmation bias. You might remember the three times your favorite EMA crossover strategy gave you a massive 100-point profit, but your brain conveniently forgets the 12 times it got chopped up in a sideways market and hit your stop loss.
Backtesting removes the emotion and exposes the raw truth of your strategy.
What is Real Backtesting?
Backtesting is the process of taking a strict set of trading rules and applying them to months or years of historical market data to see how the strategy would have performed.
A proper backtest will tell you:
- Win Rate: Out of 100 trades, how many actually hit the target?
- Maximum Drawdown: What is the longest losing streak you can expect? (This is critical for calculating your position sizing).
- Risk-to-Reward Expectancy: Does the system make more money on its winners than it loses on its losers?

The “Options Premium” Problem
Here is where most retail traders make a fatal mistake: They backtest their strategy on the Nifty Spot Chart, but they trade Options.
Because of Theta (time decay) and implied volatility crushes, an option premium does not perfectly mirror the spot chart. A strategy that looks slightly profitable on the Nifty 50 index chart might actually be a losing system when applied to Wednesday or Thursday weekly options due to rapid premium decay.
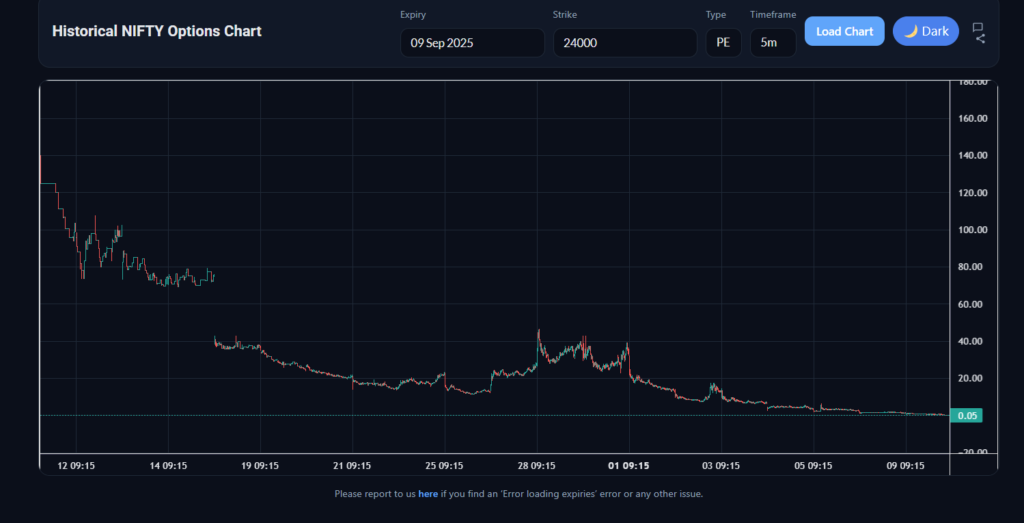
To truly backtest an intraday options strategy, you must look at historical options charts. You need to see exactly how a 21500 CE premium behaved at 10:30 AM three months ago during a specific breakout.
Psychology: Surviving the Losing Streaks
Even the best systematic traders in the world go through losing streaks. If you have not backtested your system, a string of four losses will completely destroy your psychology. You will panic, abandon your strategy, and jump to a new indicator.
But if you have backtested your system over the last 3 years of Nifty data, and you know that a 5-trade losing streak is mathematically normal for your setup, you won’t panic. You will calmly take the 6th trade, knowing your statistical edge will eventually play out and return you to profitability.
The Bottom Line
Stop treating the stock market like a casino. If you want to scale up, run multiple accounts, and treat trading as a business, you need the data to back it up. Find a reliable source of historical options charts, put in the hard hours of testing your setups, and let the math generate your income.