
Multi-Timeframe Analysis: The Top-Down Approach to Nifty Scalping
One of the biggest traps for new retail traders is “tunnel vision.” You log into your broker terminal, open a 1-minute or 3-minute Nifty 50 chart, and spend the entire day staring at microscopic price movements.
You see a bullish engulfing candle on the 3-minute chart, so you instantly buy a Call (CE) option. But within seconds, a massive red candle wipes you out. Why did your perfect 3-minute setup fail? Because you didn’t realize that the 1-hour chart was crashing straight into a massive wall of institutional resistance.
If you want to stop getting chopped up by fakeouts, you have to stop trading in a vacuum. You need to use Multi-Timeframe Analysis (MTFA). Here is how professional scalpers align the stars before they ever click the buy button.
What is the Top-Down Approach?
Think of the market like a river. The Daily chart is the overall direction of the river. The 1-hour chart is the current of the water. The 3-minute chart is just the ripples on the surface. If you try to trade the ripples against the main current, you will drown.
A Top-Down Approach means you start your analysis on a massive timeframe to find the real institutional levels, and then slowly zoom in to find your exact entry trigger.
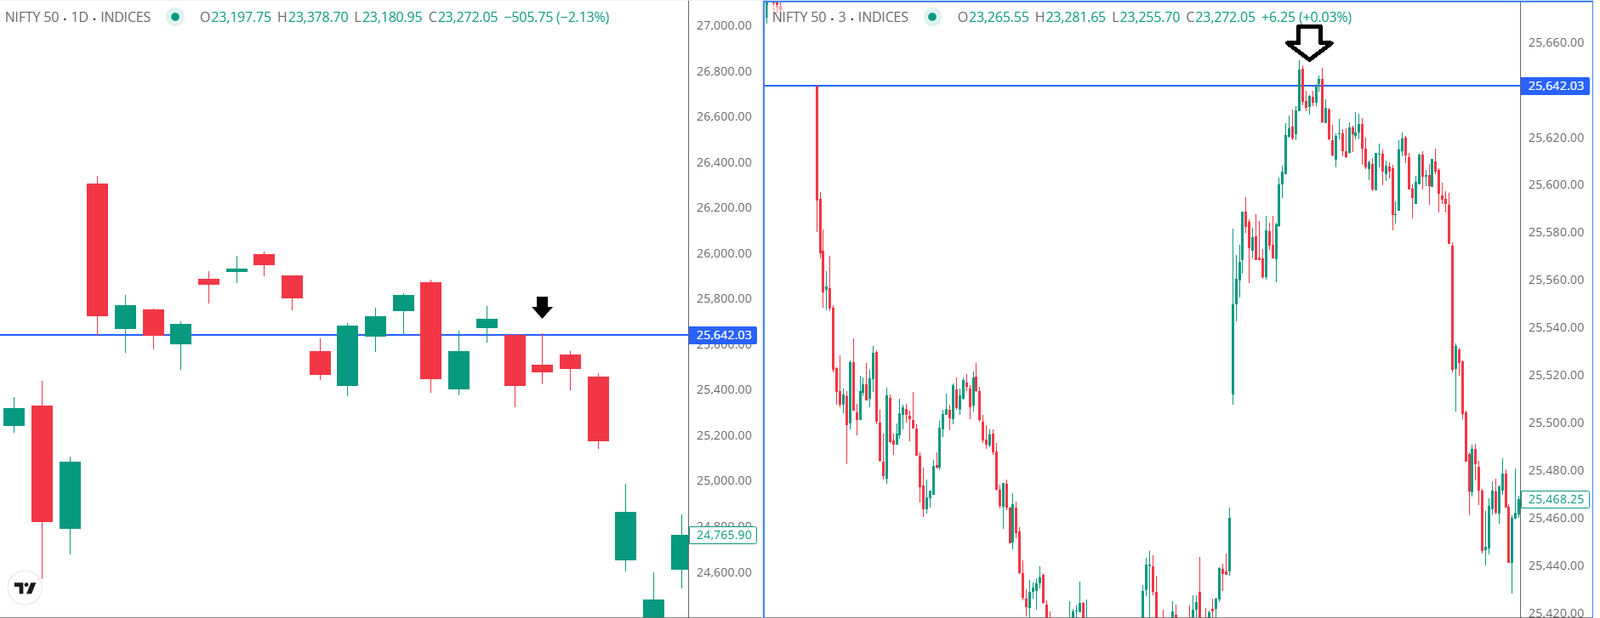
Step 1: The Daily Chart (Finding the “Real” Levels)
Before the market even opens, pull up the Daily Nifty chart.
- What is the broader trend? Are we making higher highs or lower lows?
- Mark the previous day’s High, Low, and Close.
- Mark any massive swing highs or lows from the past month. These are the lines drawn in concrete. If the 3-minute chart breaks out, but a Daily resistance line is sitting 10 points above it, the breakout will fail.
Step 2: The 1-Hour Chart (Setting the Intraday Bias)
Once your major levels are marked, zoom into the 1-Hour (or 15-minute) chart. This tells you the momentum for today.
- Is the price trading above or below the 1-hour VWAP or a major moving average (like the 20 EMA)?
- If the 1-hour chart is heavily bearish, your rule for the day becomes simple: Do not buy Calls. You only look for opportunities to short (buy Puts) on the smaller timeframes.
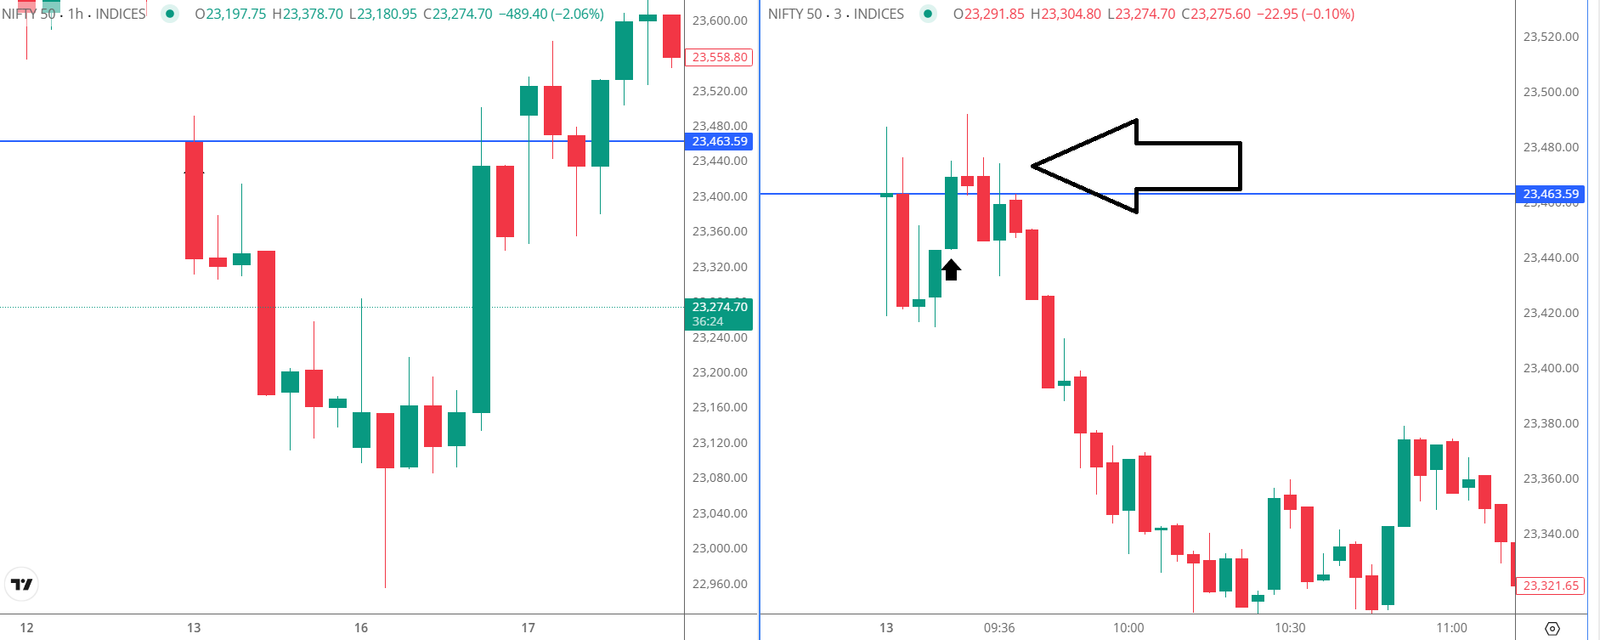
Step 3: The 3-Minute Chart (The Execution)
Now, and only now, do you drop down to your execution timeframe (3-minute or 5-minute).
You are no longer guessing. You are waiting for the 3-minute chart to agree with the 1-hour and Daily charts. If the 1-hour trend is bearish, you patiently wait for the 3-minute chart to pull back up to a resistance line, form a bearish rejection wick, and then you strike.
The Golden Rule of MTFA
Your entry timeframe (e.g., 3-minute) is only used for timing your execution and placing your stop loss. Your targets and your trend bias must always come from the higher timeframe. Align the timeframes, and watch your win rate skyrocket.