
Candlestick Patterns Every Trader Should Master
On internet you will find massive sheets with 50 different shapes. You will see names like Three Black Crows, Abandoned Baby, and Dark Cloud Cover.
Beginners print these posters out, tape them to their walls, and spend their entire trading day staring at 3-minute Nifty charts trying to match the shapes. And almost all of them lose money.
Why? Because a candlestick pattern floating in the middle of nowhere means absolutely nothing. A bullish hammer in the middle of a sideways chop is just random algorithmic noise. Candlesticks only matter when they print at a Key Institutional Level (like a major Support/Resistance line, a Pivot Point, or the VWAP).
If you want to trade like a professional, throw away the 50-pattern cheat sheet. You only need to master these three specific price action triggers.
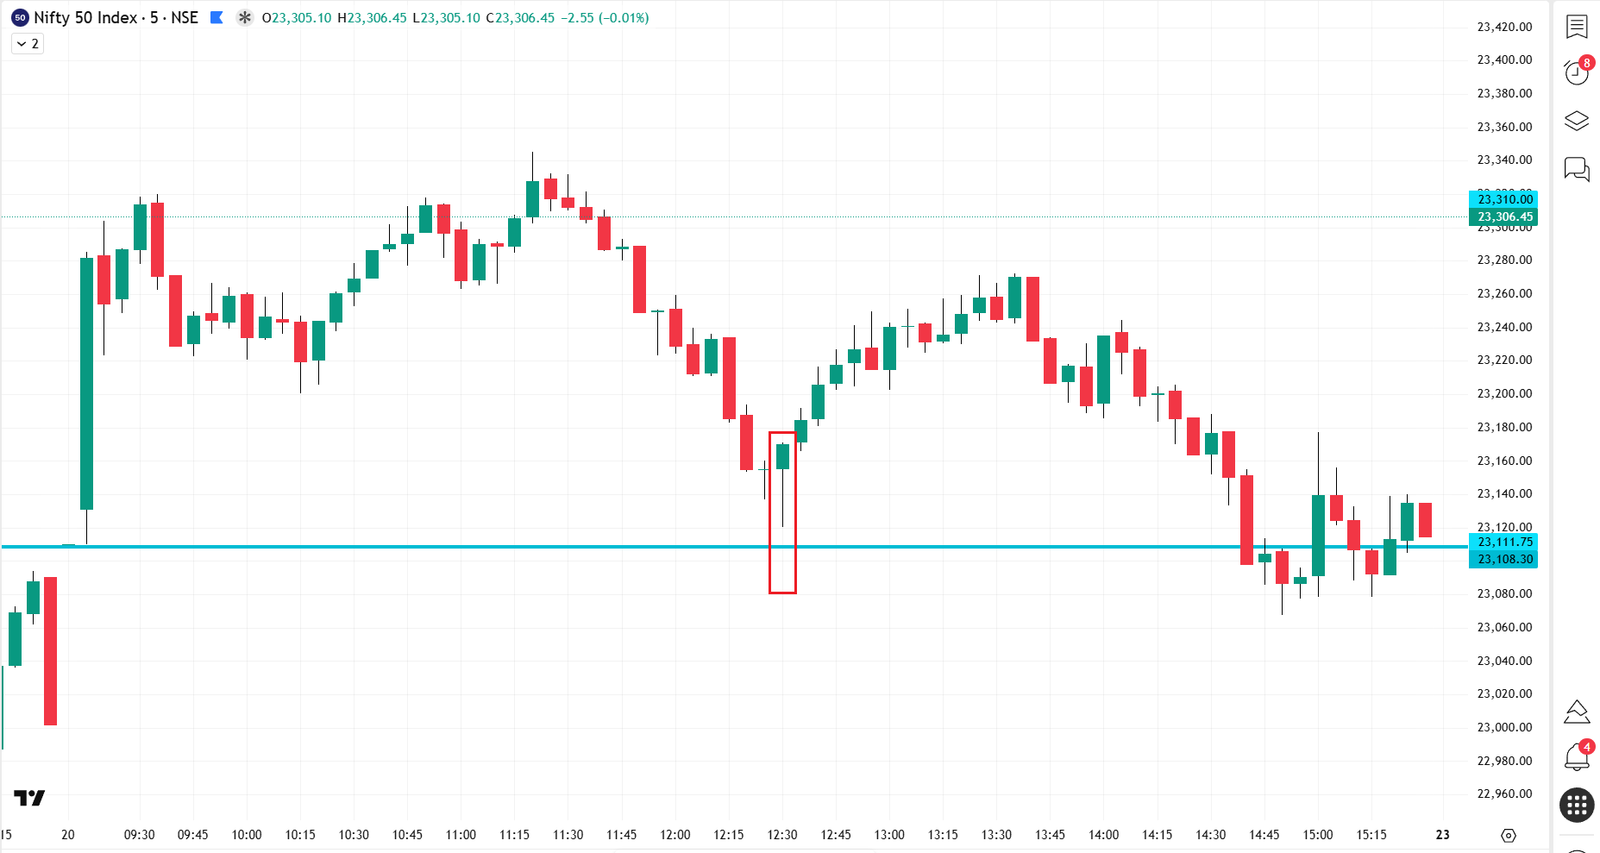
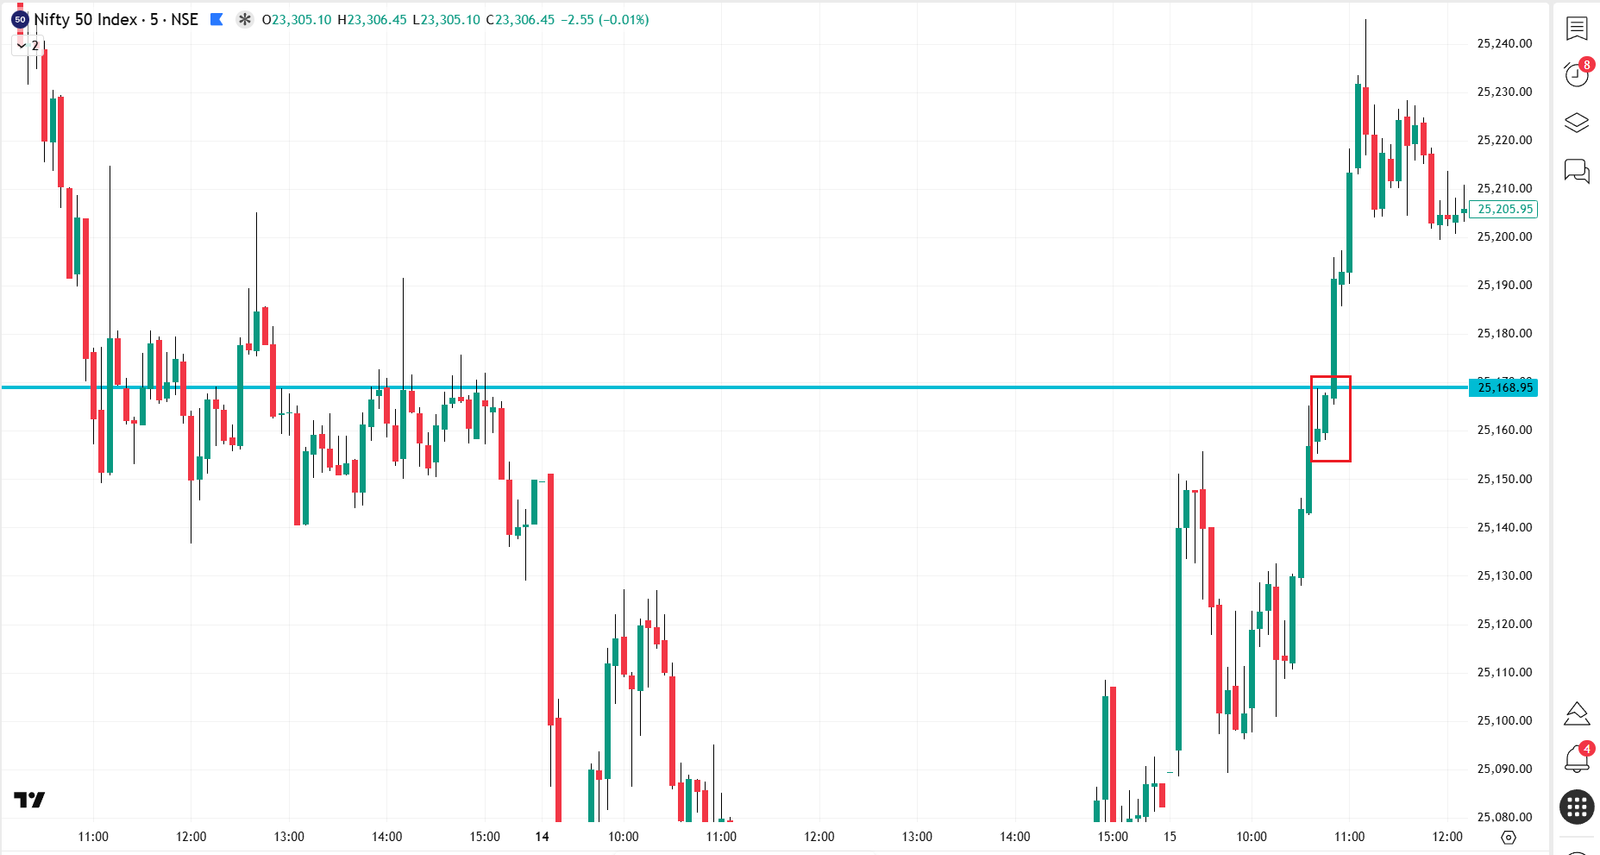
1. The Pin Bar (The Liquidity Sweep)
The Pin Bar (often called a Hammer or a Shooting Star) is the single most powerful candlestick pattern in the Indian stock market.
It consists of a small body and a massive wick that is at least twice the length of the body.
- The Psychology: A long wick represents a trap. If the Nifty drops below a major support line, retail traders instantly panic-sell Puts (PE). The institutions absorb all that selling, fill their massive buy orders, and instantly push the price back up. By the time the 5-minute candle closes, the breakout has been completely rejected, leaving a massive lower wick.
- How to Trade It: Wait for the Pin Bar to close exactly on your daily support/resistance level. Enter the trade when the next candle breaks the high (for a bullish hammer) or the low (for a bearish shooting star) of the Pin Bar. Put your stop loss safely behind the wick.
2. The Engulfing Candle (The Institutional Shift)
An Engulfing pattern happens when a small candle is immediately followed by a massive opposite-colored candle that completely “engulfs” the previous one.
- The Psychology: This represents a violent, sudden shift in power. If the Bank Nifty has been slowly grinding upward with small green candles, and suddenly a massive red candle prints that wipes out the last 15 minutes of gains, it means the bulls have completely exhausted their capital, and massive institutional sellers have stepped in.
- How to Trade It: The best Engulfing patterns happen at the top of a trend. Never trade them in the middle of a range. Wait for the market to hit an R1 or R2 Pivot Point, print a Bearish Engulfing, and ride the momentum back down to the VWAP.
3. The Inside Bar (The Coiled Spring)
While Pin Bars and Engulfing candles signal reversals, the Inside Bar is the ultimate breakout pattern.
An Inside Bar occurs when a candle’s high and low are completely contained within the high and low of the previous candle (the “Mother Bar”).
- The Psychology: This pattern represents extreme volatility contraction. The buyers and sellers are deadlocked. The market is taking a deep breath, coiling up like a spring.
- How to Trade It: This is a fantastic pattern to pair with the Opening Range Breakout (ORB). If the Nifty is resting just below a major breakout line and prints 2 or 3 Inside Bars in a row, the explosion is imminent. Place an SL-Limit buy order just above the Mother Bar’s high, and catch the Gamma blast when the spring uncoils.
Stop trying to memorize 50 different Japanese names. Focus on the story the wick is telling you, wait for the price to hit your predetermined levels, and keep your execution simple.