
How Top Bank Stocks Actually Control the Bank Nifty Index
If you are trying to trade Bank Nifty options by only looking at the Bank Nifty chart, you are staring at a shadow and trying to guess what is casting it.
The Bank Nifty is not an independent living breathing entity. It is a mathematically derived number based on the real-time stock prices of 12 Indian banks. But here is the dirty little secret that traps most beginner traders: Those 12 banks are not treated equally.
If you want to stop getting trapped by sudden, inexplicable reversals on the Bank Nifty, you have to stop trading the index blindly and start watching the “Puppet Masters” that actually pull the strings.
The Weightage Reality: The “Big Two”
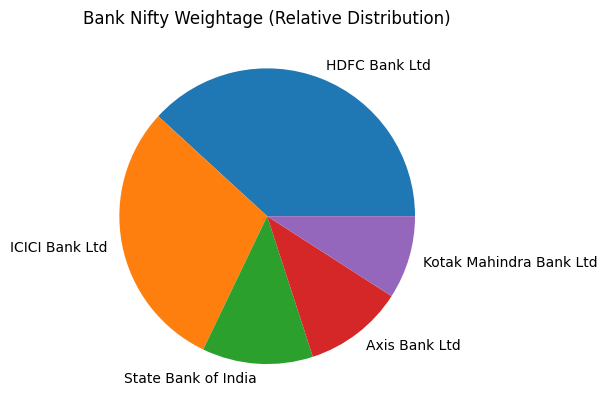
The Bank Nifty is a free-float market-capitalization-weighted index. This means the biggest banks move the index the most.
While there are 12 banks in the index, HDFC Bank and ICICI Bank together control roughly 45% to 50% of the entire index’s movement. (Depending on minor quarterly rebalancing). Add State Bank of India (SBI), Axis Bank, and Kotak Mahindra Bank to the mix, and you are looking at over 80% of the index weightage.
The bottom 7 banks (like Punjab National Bank, IDFC First, etc.) are basically irrelevant to intraday option scalpers. They could all crash 5%, but if HDFC and ICICI are rallying, the Bank Nifty will still go up.
The “Divergence Trap”
Here is the classic trap that blows up retail accounts: You look at the 5-minute Bank Nifty chart. It forms a beautiful Bullish Engulfing candle right at a major support level. You aggressively buy a Call (CE) option. But instead of rallying, the index suddenly stalls, chops around for 15 minutes, and then crashes through support, hitting your stop loss.
Why did the perfect chart pattern fail?
Because while the Bank Nifty looked bullish, HDFC Bank was hitting a major daily resistance line and facing heavy institutional selling. The index cannot break out if its biggest component is getting crushed.
The Professional Setup: The Three-Chart Screen
You cannot trade Bank Nifty efficiently on a single monitor or a single chart layout. Professional Bank Nifty scalpers always use a multi-chart layout.
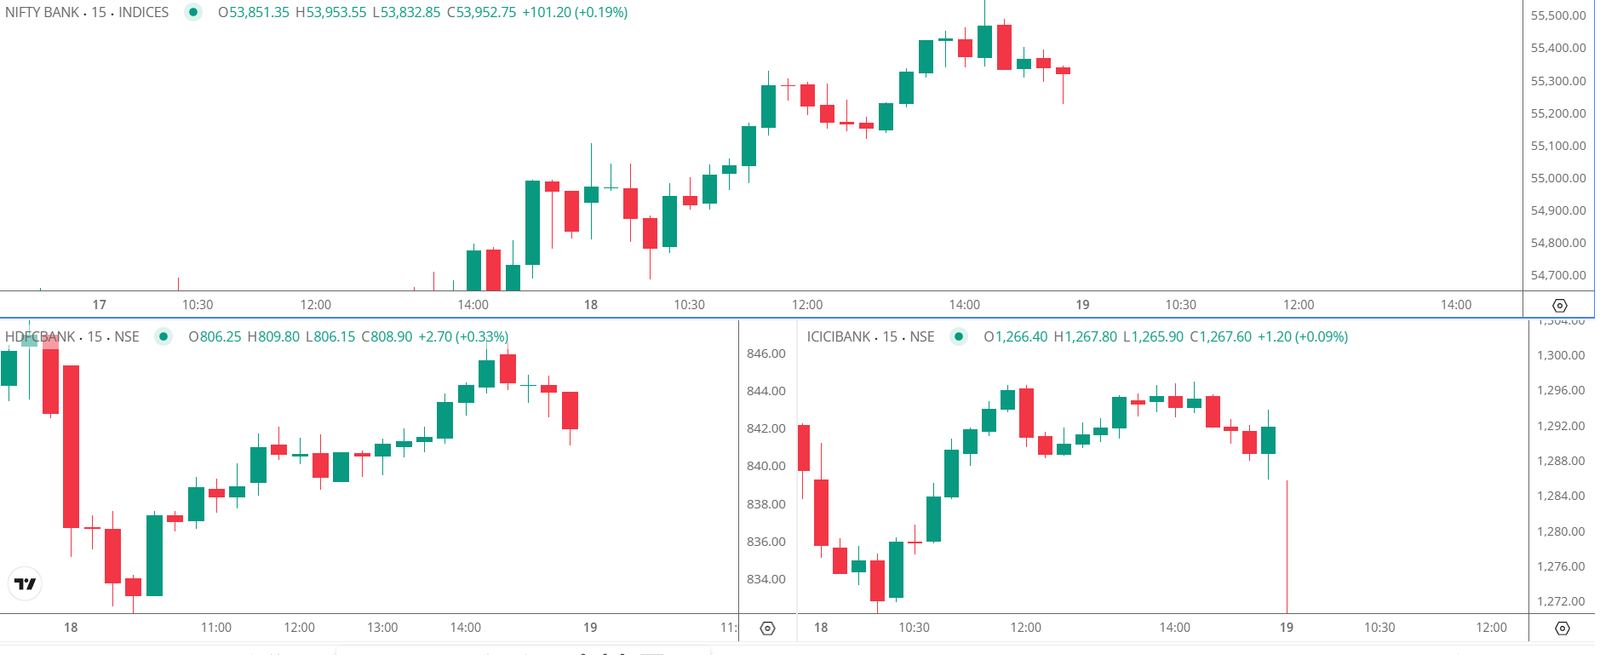
If you want to trade Bank Nifty, your screen must show:
- The Bank Nifty Spot Chart (Your primary execution chart).
- HDFC Bank Spot Chart (The Anchor).
- ICICI Bank Spot Chart (The Co-Pilot).
The Execution Rule
Before you buy a Bank Nifty Call option on a breakout, glance at HDFC and ICICI.
- Are they also breaking out? Take the trade. The momentum is real.
- Is HDFC sideways while ICICI is dragging the index up? The breakout will be slow and choppy. Reduce your lot size.
- Are HDFC and ICICI moving in completely opposite directions? Do not trade. The index will just consolidate and eat your option premium via Theta decay.
Stop treating the Bank Nifty like a single stock. Track the heavyweights, look for alignment, and trade the actual money flow.