
Statistical Arbitrage Basics: Turning Data Patterns into Trading Edge
If you spend enough time observing the financial markets, you will quickly realize that the industry is divided into two distinct worlds. On one side, you have the retail trading crowd. This group relies on “gut feeling,” chart patterns, breaking news headlines, and emotional reactions. They constantly search for the next massive breakout, hoping to invest their capital into a single asset that will double in value.
On the other side of the spectrum, you have the institutional world of quantitative finance. Inside the proprietary trading desks of massive global banking institutions and multi-billion-dollar hedge funds, there is no emotion. There are no gut feelings. There are no traders screaming at screens. Instead, there are servers, algorithms, and mathematical models quietly processing millions of data points every second.
These elite institutions do not care about the fundamental story of a stock. They do not care who the CEO is. They only care about one thing: Mathematical Mispricing.
To exploit these mispricings, they use a highly advanced, market-neutral strategy called Statistical Arbitrage (often referred to as “Stat Arb”). For decades, this strategy was locked behind the closed doors of Wall Street. Today, with the democratization of coding languages like Python and advanced charting platforms, serious retail traders can build their own Stat Arb models.
If you want to stop gambling on direction and start extracting an edge from pure data, you need to understand the mechanics of Statistical Arbitrage.
The Myth of “Risk-Free” Arbitrage
Before we build the system, we have to define the terminology.
In classical finance, “Arbitrage” refers to a completely risk-free transaction. For example, if a commodity is trading at 100 units on Exchange A, and 102 units on Exchange B, a trader can simultaneously buy it on Exchange A and sell it on Exchange B, locking in a 2-unit profit without taking any directional risk. Today, classical arbitrage is entirely dominated by high-frequency trading computers operating in microseconds. The retail trader cannot compete in this arena.
Statistical Arbitrage is different. It is not risk-free. Instead of relying on absolute certainty, it relies on statistical probability and the Law of Large Numbers.
Think about how an insurance company operates. An insurance company does not know exactly who will crash their car this year. However, by looking at decades of data, they know the statistical probability of how many cars will crash. They price their premiums accordingly. They might lose money on a few policies, but over a sample size of 10,000 policies, they are mathematically guaranteed to generate massive wealth.
Stat Arb applies this exact same “casino math” to the stock market. You are not looking for a trade that is guaranteed to win. You are looking for a structural pricing anomaly that has a 65% probability of reverting to its historical mean. Over 1,000 trades, that statistical edge becomes a money-printing machine.
The Core Engine: Mean Reversion on Steroids
At its absolute core, Statistical Arbitrage is an evolution of Pair Trading.
As we discussed in previous strategies, Pair Trading involves taking a long position in one asset and a short position in a highly correlated asset, betting that the spread between them will eventually close.
Stat Arb takes this concept and scales it exponentially. Instead of looking at two individual stocks, a Stat Arb model looks at an entire universe of assets. It groups them into “baskets” or “portfolios.”
Imagine you are analyzing the global banking sector. You build a custom basket of 15 major bank stocks. Because these banks all operate in the exact same macroeconomic environment, their prices should generally move together as a cohesive unit.
A Stat Arb algorithm constantly calculates the average valuation of this entire 15-stock basket. This average acts as the “Mean.” Suddenly, the algorithm detects that Bank #4 has spiked in price by 4%, while the other 14 banks in the basket have remained perfectly flat. There is no fundamental news to justify this spike.
The algorithm identifies Bank #4 as a statistical anomaly. It has detached from the gravitational pull of its peer group. The Stat Arb system will immediately execute a short position on Bank #4, while simultaneously taking a long position on the remaining 14 banks (or a sectoral index) to hedge out the systemic market risk.
The strategy does not care if the banking sector goes up or down tomorrow. It only cares that Bank #4 is stretched too far from its peers and must eventually snap back into line.
The Math of the Edge: Standard Deviation and Z-Scores
You cannot build a Stat Arb model by simply looking at a price chart and guessing if a stock looks “too high” or “too low.” You must quantify the mispricing using rigorous statistics.
The most vital mathematical tool in a quantitative trader’s arsenal is the Z-Score.
A Z-Score is a statistical measurement that tells you exactly how far a data point is from the historical average, measured in units of Standard Deviation.
The formula is incredibly simple but violently powerful: Z=StandardDeviationPrice−Mean
- Price: The current spread or price of the asset.
- Mean: The moving average of that spread over a specific lookback period (e.g., 20 days).
- Standard Deviation: The measure of historical volatility.
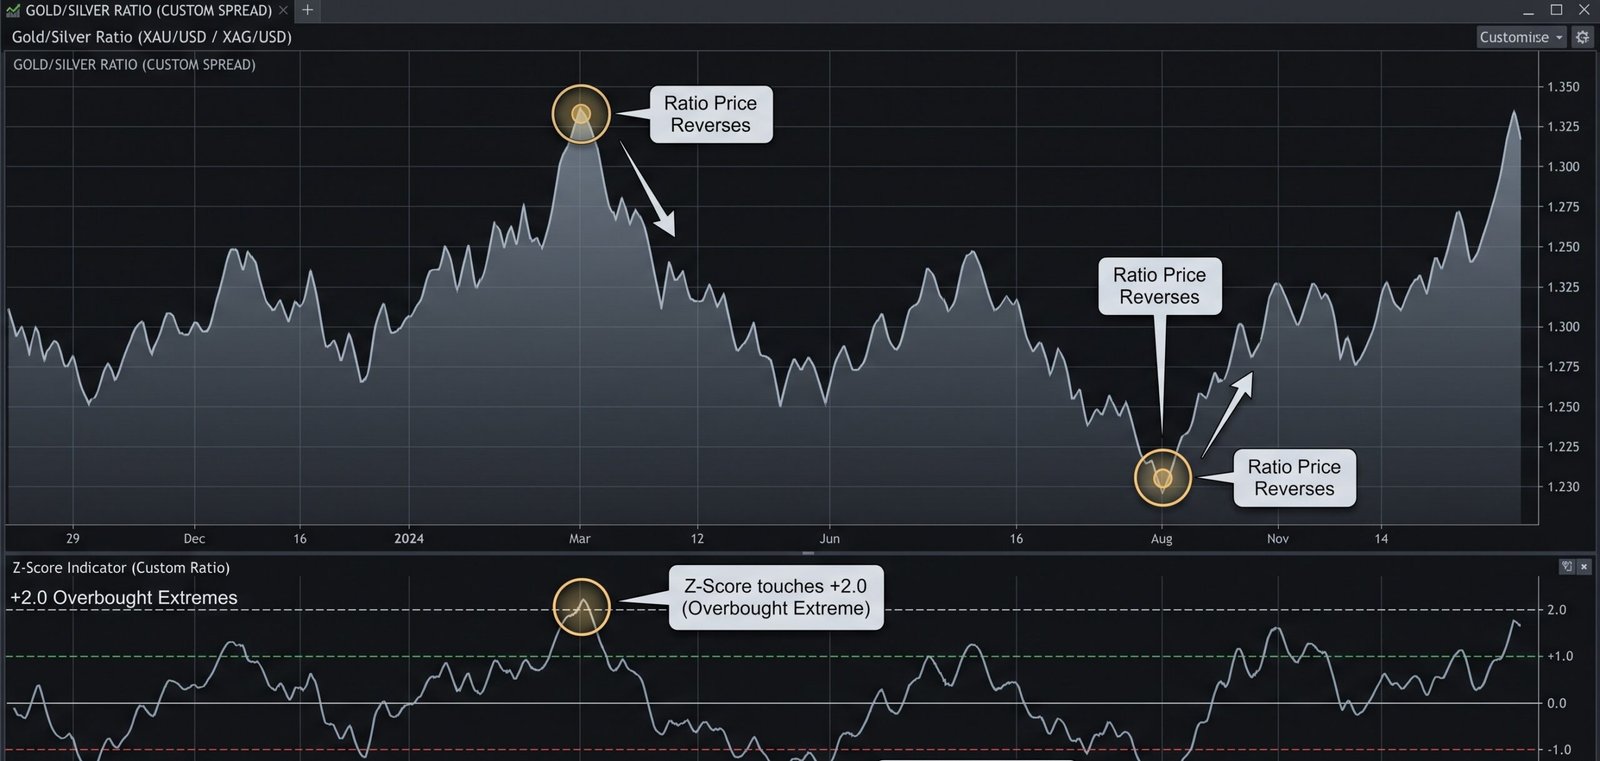
If a stock’s relationship to its sector has a Z-Score of 0, it is trading exactly at fair value. If the Z-Score hits +2.0, it means the stock is trading two standard deviations above its historical mean. Statistically, price action is expected to remain within two standard deviations roughly 95% of the time.
Therefore, a Z-Score of +2.0 or -2.0 is your ultimate algorithmic trigger. It is a mathematical siren screaming that the current pricing is highly irrational and highly likely to revert.
The Execution Stack: Moving from Discretionary to Systematic
Because Statistical Arbitrage relies on executing a high volume of trades to let the probabilities play out, it is almost impossible to execute manually.
If your model requires you to short one overvalued asset while simultaneously buying a basket of 10 undervalued assets to remain Delta-neutral, human fingers are simply too slow. By the time you calculate the lot sizes and click the buttons, the bid-ask spreads will have shifted, and your statistical edge will vanish into slippage.
This is why true Stat Arb requires a robust technology stack.
Professional retail quants use languages like Python or advanced Pine Script logic to automate the entire process.
- Data Ingestion: The code constantly pulls live price data for an entire watchlist of assets via broker APIs.
- Signal Generation: The code calculates the moving averages, standard deviations, and Z-Scores in milliseconds.
- Risk Calculation: The code dynamically calculates the exact position sizing required to ensure the long portfolio and the short portfolio have an perfectly balanced cash value (ensuring the trade uses credit and margin efficiently).
- Execution: The moment the Z-Score hits +2.0, the code fires simultaneous limit orders across multiple assets to lock in the spread.
If you want to trade Stat Arb, your primary job is no longer clicking “buy” or “sell.” Your job is building, monitoring, and optimizing the logic engine.
Ironclad Risk Management: The Fixed-Point Rule
The greatest danger in Statistical Arbitrage is assuming that a historical relationship will always hold true.
Sometimes, a Z-Score hits +3.0, and instead of mean-reverting, it continues climbing to +4.0, +5.0, and beyond. This happens when there is a fundamental, structural shift in the asset. For example, if a company announces a revolutionary technological breakthrough, its relationship to its sector is permanently altered. The old mean is dead.
If your algorithm stubbornly keeps shorting this asset because it assumes it “has to” come back down, your trading account will be completely liquidated.
To survive these structural breaks, you must remove all emotion and subjectivity from your risk management. Many amateur system builders try to use percentage-based drawdowns to manage their trades (e.g., “I will exit if my account drops by 2%”). This is a flawed approach because it reacts to the size of your account, not the behavior of the data.
To trade like an elite institution, your risk parameters must be mathematically hardcoded into the geometry of the spread itself. You must use fixed-point parameters.
Once your model identifies the entry, you establish a strict 400-point target and a hard 200-point stop loss on the spread differential.
- The 400-Point Target: This is not a random number of cash you hope to make. This represents the calculated mathematical distance from the extreme Z-Score back to the historical mean. Once the spread compresses by those 400 points, your algorithm must ruthlessly close all positions and book the profit. Do not hold it hoping for extra gains.
- The 200-Point Stop Loss: This is your structural failsafe. If the spread expands by a fixed 200 points against your entry, it is mathematical proof that the historical co-integration is broken. You do not wait. You do not adjust the code. You do not hope for a reversal. The algorithm automatically closes the entire portfolio at a loss.
By enforcing this strict 400-point target and 200-point stop loss, you are guaranteeing a 1:2 Risk-to-Reward ratio on your system. You can suffer through a streak of broken correlations, be wrong on half of your entries, and the mathematics of your fixed-point risk management will still ensure your portfolio remains highly profitable.
The Institutional Conclusion
Statistical Arbitrage is the ultimate evolution of the active trader. It allows you to completely divorce yourself from the chaotic, unpredictable news cycle. It doesn’t matter if inflation spikes, if interest rates change, or if the global economy enters a recession.
By defining sectors, calculating historical means, utilizing Z-Scores to identify extreme deviations, and enforcing rigid fixed-point risk parameters, you stop predicting the future. You become an insurance provider to the market, capitalizing on the temporary irrationality of the crowd.
Stop staring at single charts hoping for a directional miracle. Start looking at the relationships between the data, build your mathematical baskets, and let the undeniable laws of probability generate your edge.